

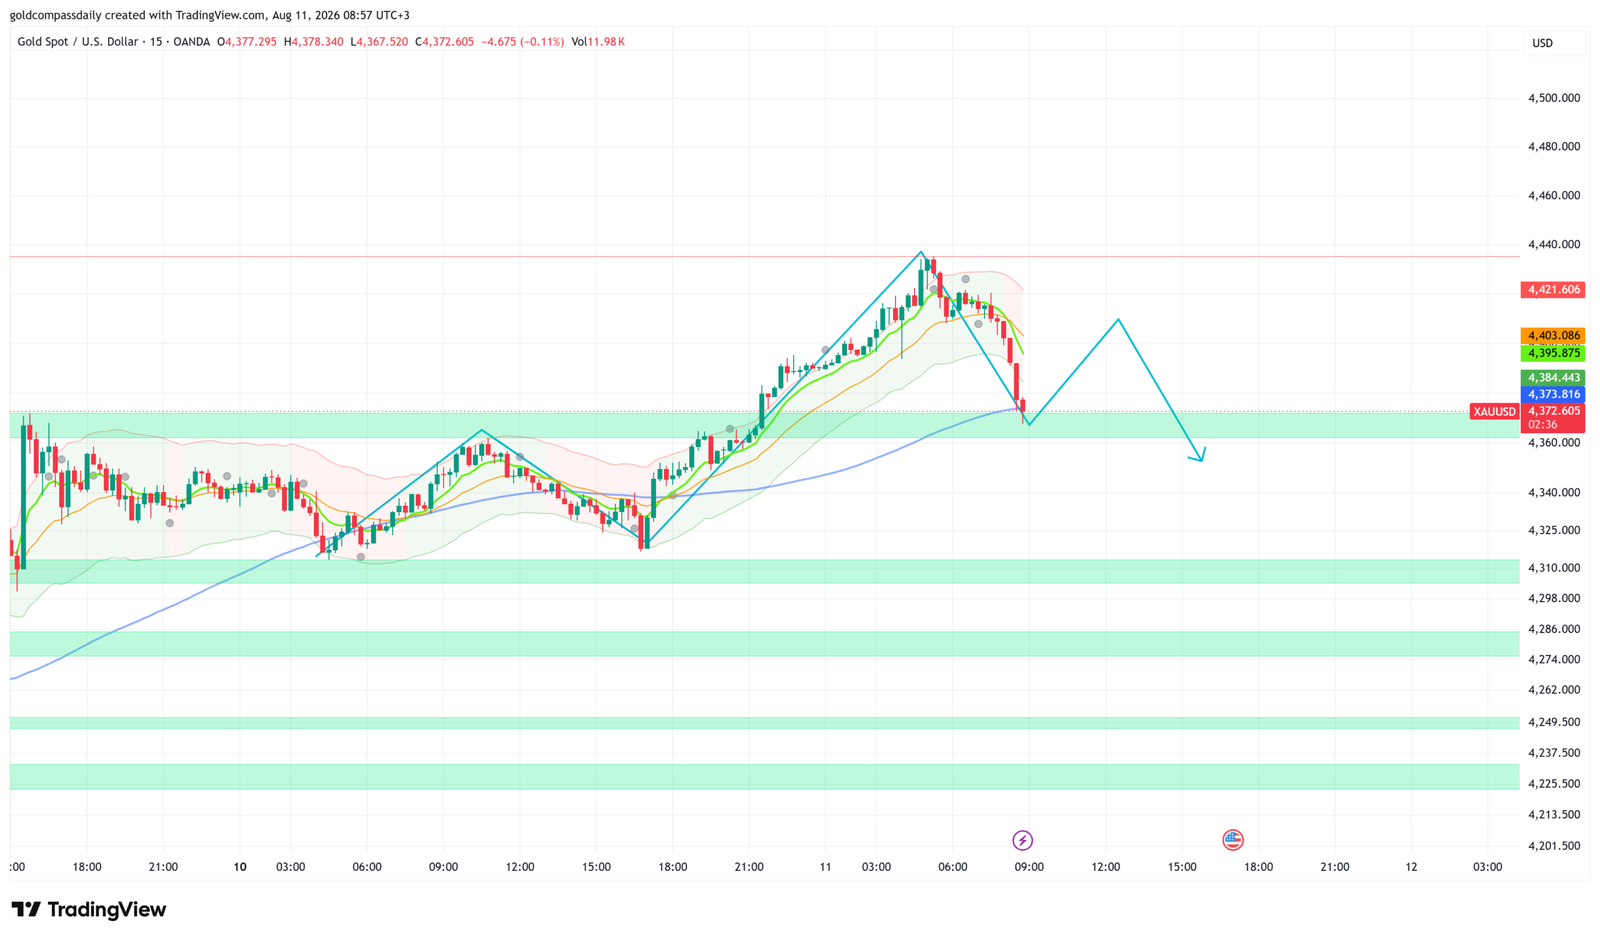
Gold trades cautiously bullish at $4,372 after a sharp reversal from a session high of $4,440, with the pullback unfolding ahead of Wednesday’s US CPI — the week’s defining macro event. The $4,367–$4,373 support band is absorbing the retracement, and structure remains constructive while that zone holds.
Key Levels
- Bias: Bullish above $4,367
- Support: $4,367–$4,373 → $4,310
- Resistance: $4,395–$4,403 (MA cluster) → $4,421 → $4,440 (session high)
- Session target: $4,421 (conditional on $4,367 holding and US data missing estimates)
- Invalidation: Below $4,367 on a closing basis = retest of $4,310 opens
Catalyst of the Day
Tuesday’s primary catalyst for gold is the NFIB Small Business Optimism Index at 13:00 UTC+3, with the forecast sitting at 97.5 against the prior 97.4. While not a tier-one mover on its own, the NFIB reading carries weight this week as a leading sentiment indicator for small-cap economic health — deterioration here reinforces the narrative that the US growth outlook is softening, which is structurally supportive for gold as a safe-haven and real-rate hedge. Existing Home Sales at 17:00 UTC+3 (forecast 4.05M versus prior 4.09M) offer a secondary read on consumer financial stress. A miss on either print — particularly a deterioration in small business confidence — removes a layer of dollar support heading into Wednesday’s CPI. Traders should watch the US dollar index reaction at each release: a DXY rejection below the 102.50–103.00 zone would be the clearest green light for a gold recovery toward $4,421.
Fundamental Context
Gold’s spike to $4,440 overnight was driven by pre-CPI positioning and continued institutional demand for safe-haven assets as markets process the implications of a slowing US labour market — Friday’s NFP data firmed expectations that the Federal Reserve’s next move is a cut rather than a hold. The subsequent pullback to $4,372 reflects profit-taking and position squaring ahead of Wednesday’s CPI print rather than a structural shift in demand. Until inflation data materially disappoints to the downside, the underlying bid beneath gold remains intact.
The macro backdrop continues to favour gold on a medium-term basis. Real yields — the most reliable inverse driver of gold prices — have stalled near their recent highs, failing to reclaim the levels that previously capped the metal. With the Fed widely expected to signal cuts before year-end and fiscal deficits in the US remaining elevated, the structural case for gold as a store of value and portfolio hedge has not changed. Tuesday’s Australian RBA decision (rate held at 4.35% as expected) reinforces a global central bank backdrop where the cutting cycle is broadening — a net positive for non-yielding assets such as gold.
Chart Analysis
The 15-minute XAU/USD chart on OANDA as of 08:57 UTC+3 shows a clean bullish impulse from the $4,310 base through Sunday’s Asian session, reaching $4,440 during early Tuesday trade before a sharp rejection. Price has retraced approximately $68, settling at $4,372 — directly into a visible horizontal support zone that has been tested and held on the chart. The short-term green moving average has crossed below the orange medium-term MA, signalling near-term bearish momentum; however, the long-term blue MA continues to slope upward, confirming the broader trend remains intact. Bollinger Bands show price exited the upper band at the $4,440 spike and snapped back to the midline area, consistent with a mean-reversion move rather than a trend reversal. The chart’s projected path (cyan) suggests a potential shallow bounce toward $4,395–$4,403 (the MA cluster zone) before a possible further leg toward $4,358–$4,362 if support fails — that would constitute the deeper retest scenario ahead of CPI. The $4,367–$4,373 band is the line in the sand: bulls need a confirmed hold here on the 15-minute close to keep the $4,421 target viable.
Bull / Bear Scenarios
Bull Scenario
Trigger: Price holds $4,367–$4,373 on a 15-minute closing basis and US NFIB or Existing Home Sales miss consensus → Target: $4,421, extension to $4,440. A reclaim of $4,403 on rising volume confirms the retracement is complete.
Bear Scenario
Trigger: Hourly close below $4,367 with no immediate reclaim → Target: $4,310 support zone. This scenario plays out if US data beats and the dollar index recovers above 103.00, compressing pre-CPI safe-haven demand. Below $4,310, the $4,286 and $4,249 zones come into view.
Events Ahead
- Tuesday 13:00 UTC+3 — NFIB Small Business Optimism (forecast 97.5): Softer reading weakens the dollar narrative and supports gold’s retracement floor.
- Tuesday 17:00 UTC+3 — Existing Home Sales (forecast 4.05M): A miss signals consumer financial strain and reinforces the rate-cut case, supportive for gold.
- Wednesday — US CPI (July): The week’s defining event. A hot print pressures gold; a cool or in-line print validates the bull case and opens a run toward $4,440 and beyond.
- Friday — US Retail Sales: Secondary confirmation of consumer health; directional gold driver only if CPI has already shifted the rate-cut calculus.
For the full week’s macro context, event calendar, and scenario framework, see the Gold Compass Daily Week Ahead: August 10–14, 2026. Monday’s session analysis is available here: XAU/USD Bullish at $4,342 — CPI Week Opens With Upside Bias Intact.
New York Session Update
Price Check
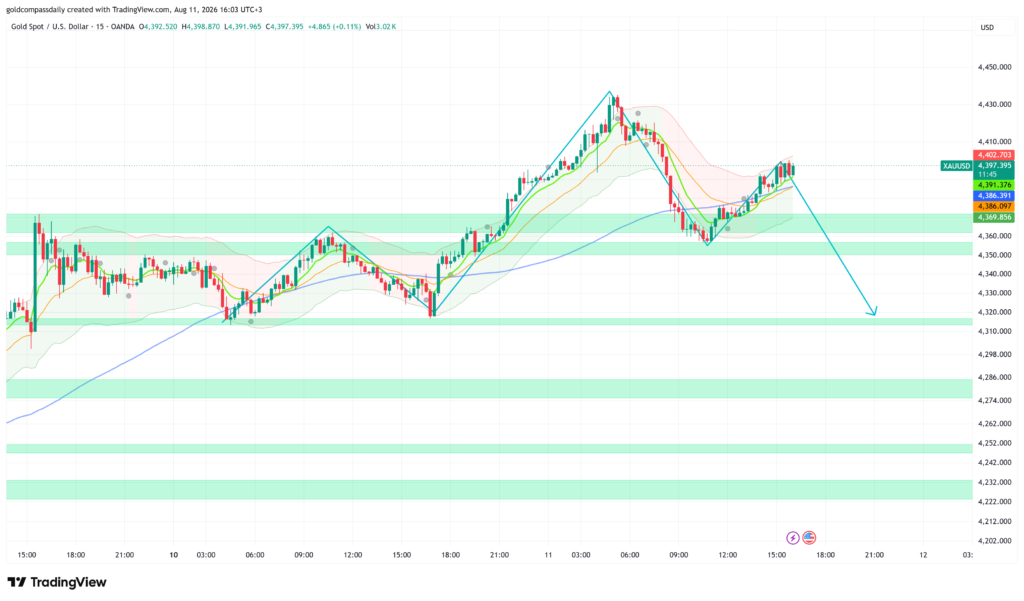
Gold trades at $4,397 as the New York session gets underway — up approximately $25 from the morning analysis price of $4,372, confirming the bullish bias outlined earlier. The $4,367–$4,373 support band held exactly as flagged, and price has since recovered toward the $4,402 resistance zone.
What Changed
Price extended the morning rebound, pushing to $4,430 before stalling into consolidation. The move validated the bull scenario from the morning analysis — the $4,367–$4,373 floor held on a closing basis and the bounce through $4,403 triggered follow-through buying. Price is now consolidating just below the $4,402–$4,403 MA cluster, which has flipped from resistance into a potential support reference. With no major US data beats to strengthen the dollar, the path of least resistance has remained to the upside through the European session. Attention now shifts to the New York afternoon: the API Weekly Statistical Bulletin is due at 23:30 UTC+3, though its direct gold impact is limited. The session is increasingly trading as pre-CPI positioning, with participants unwilling to extend aggressively in either direction ahead of tomorrow’s inflation print.
Updated Levels
- Current price: $4,397
- Bias now: Bullish — unchanged; $4,367 support held and structure has improved
- Updated support: $4,386–$4,391 → $4,369 → $4,360
- Updated resistance: $4,402–$4,403 → $4,430 → $4,440
- NY session target: $4,402–$4,403 reclaim on a closing basis; extension to $4,430 if volume confirms
Scenarios Into the Close
Bull: Price holds above $4,386 and reclaims $4,403 on a 15-minute close → retest of $4,430 opens, with $4,440 as the pre-CPI ceiling.
Bear: Rejection at $4,402–$4,403 and a drop below $4,369 on a closing basis → projected move toward $4,320 as the chart’s cyan path suggests, ahead of Wednesday’s CPI reset.
Chart Analysis
The 15-minute OANDA chart as of 16:03 UTC+3 shows price consolidating at $4,397 after a clean recovery from the morning low. The session high of $4,430 is visible as a clear swing rejection point, and price has pulled back into a tight range between $4,386 and $4,403. The short-term green MA has crossed back above the orange medium-term MA — a positive signal that the retracement from $4,440 is complete and momentum has rotated back to the upside. The long-term blue MA continues to slope upward well below current price, confirming the macro trend. The Bollinger Band midline sits near $4,391, providing dynamic support. The chart’s projected cyan path shows a potential deeper leg toward $4,320 if the current consolidation fails — a scenario that gains credence only on a clean break below $4,369. For now, the structure favours continuation toward $4,430 while price holds inside the $4,386–$4,403 range.
Analysis based on the XAU/USD 15-minute chart as of August 11, 2026, 08:57 UTC+3. This article is for informational and educational purposes only and does not constitute financial advice.