

Gold trades cautiously bullish at $4,394 on Wednesday, holding above key short-term support as markets position ahead of the most consequential data release of the week. The US Consumer Price Index print at 3:30 PM UTC+3 will determine whether XAU/USD has the fundamental fuel to push through $4,410 resistance and reclaim the $4,430–$4,440 territory visited earlier this week. The bullish structure remains intact, but the market is in a wait-and-see posture until the data lands.
Key Levels
- Bias: Bullish above $4,382
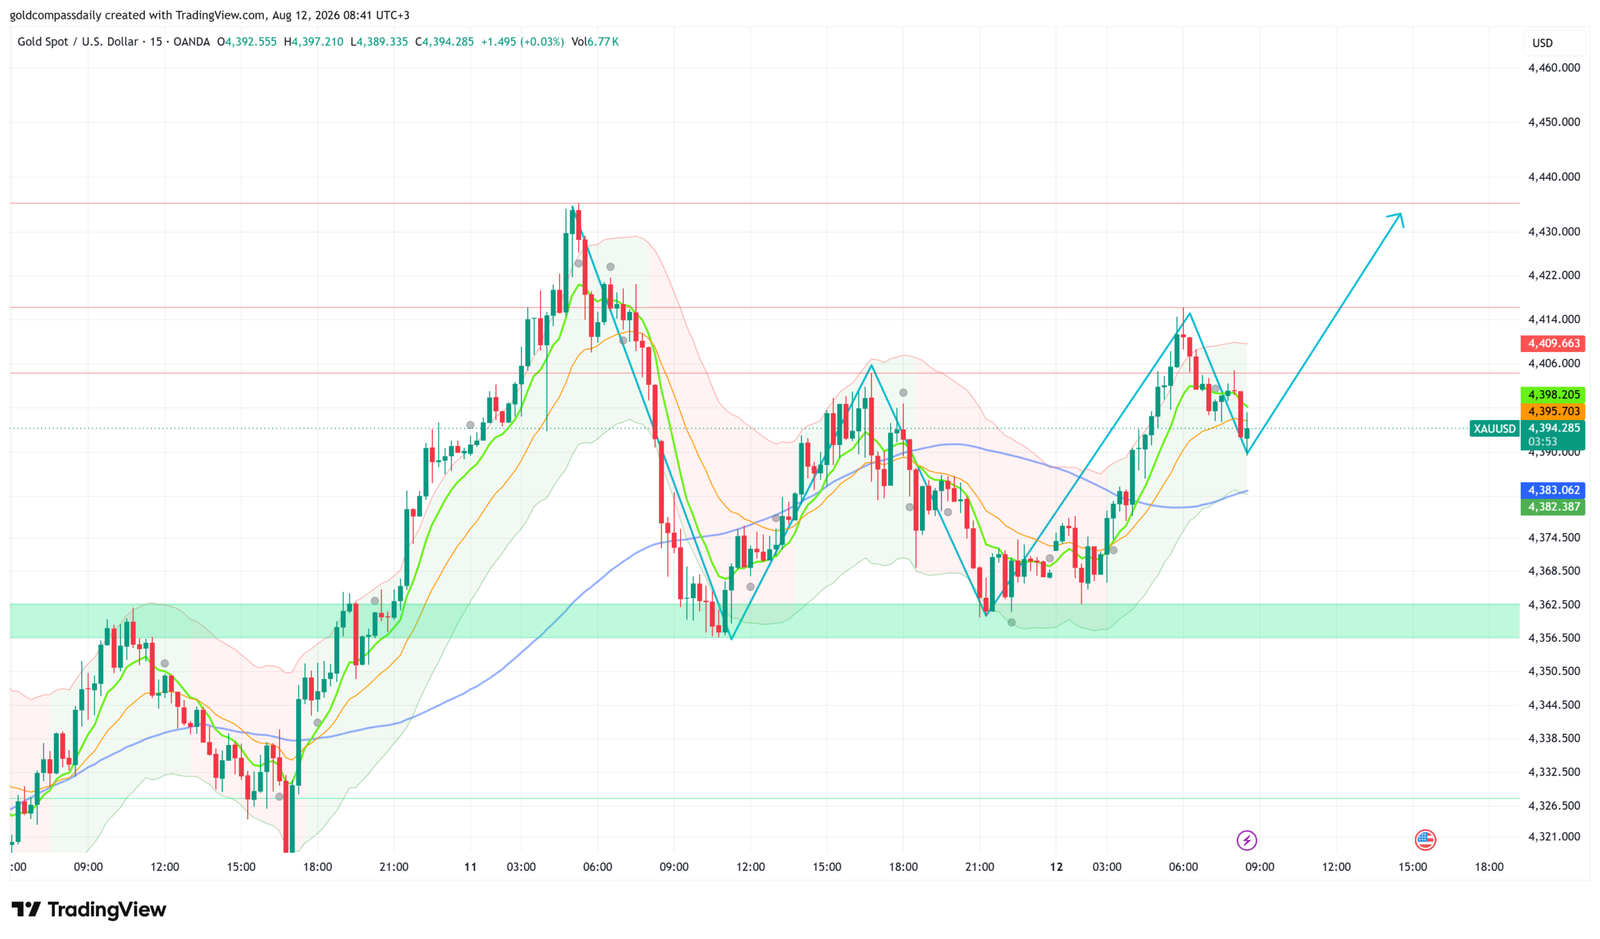
- Support: $4,382 → $4,362–$4,356 (major demand zone)
- Resistance: $4,398 → $4,410 → $4,430
- Session target: $4,430 (conditional on CPI miss to the downside)
- Invalidation: Daily close below $4,356 = bullish structure broken, short-term bias flips neutral
Catalyst of the Day: US CPI — 3:30 PM UTC+3
The August 12 US CPI release is the defining event for gold this session. Markets are pricing Core CPI m/m at 0.2% — a step up from June’s flat 0.0% reading — and headline CPI y/y at 3.4% against a prior 3.5%. For gold, the calculus is straightforward: a soft or in-line print strengthens the case for Fed rate cuts later in 2026, suppressing real yields and weakening the dollar — both tailwinds for XAU/USD. A hot surprise, with Core CPI printing at 0.3% or above, risks a sharp retracement toward $4,362 as rate cut expectations get repriced out of the curve. Watch the Core CPI m/m figure at 3:30 PM UTC+3 as the primary trigger. The initial 15-minute candle after the release will set the session’s directional tone.
Fundamental Context
Gold’s macro environment remains structurally supportive entering this week’s data gauntlet. The Fed under Chair Kevin Warsh has maintained a data-dependent posture, and the market is increasingly sensitive to any signal that disinflation is re-accelerating after June’s anomalous flat Core CPI. Yesterday’s CPI eve session saw XAU/USD pull back from the $4,440 cycle high — a pattern consistent with institutional positioning ahead of binary risk events rather than a structural change in trend. The pullback to $4,360 before recovering to $4,394 reflects healthy consolidation rather than distribution.
On the dollar side, the DXY has shown limited upside conviction despite resilient economic data, and US 10-year yields remain a key transmission mechanism. Today’s 10-year Bond Auction at 8:01 PM UTC+3 carries secondary significance — a weak auction (high yield, low bid-to-cover) could push real yields higher and cap gold’s post-CPI upside, while strong demand at the auction would reinforce the bid in gold. Crude Oil Inventories at 5:30 PM UTC+3 and the Federal Budget Balance at 9:00 PM UTC+3 are lower-tier catalysts, but a large inventory draw supporting energy prices could contribute to broader inflation narrative complexity going into the close.
Chart Analysis
The 15-minute XAU/USD chart as of 08:41 UTC+3 on August 12 shows a market that has staged a clear recovery from the August 11 low near $4,360, with price climbing back through the $4,382–$4,383 short-term MA cluster and reaching a session high of $4,397 before consolidating at $4,394. The green demand zone spanning $4,356–$4,362 has now been tested twice and held on both occasions — first on August 10–11 and again during the early August 12 session — establishing it as the critical structural floor. The moving average stack is bullish: the shorter-period MAs (green and orange) are curling upward through the $4,395–$4,398 zone, while the slower blue MA at approximately $4,382 is acting as dynamic support. The annotated projection on the chart targets a move back toward $4,430 on a CPI-driven catalyst, which aligns with the prior cycle high and the next meaningful resistance level. The $4,409–$4,410 zone, marked by the red horizontal line on the chart, represents the first significant resistance that must give way before $4,430 becomes accessible. Price currently sits just below the $4,398 level — a clean break and hold above this level pre-CPI would be an early constructive signal.
Bull / Bear Scenarios
Bull Scenario
Trigger: Core CPI m/m prints at 0.2% or below → Gold breaks $4,410 within 30 minutes of the release → Target: $4,430, extension to $4,440. A clean reclaim of $4,410 on the 15-minute chart with two consecutive closes above that level confirms the path is open to retest the cycle high.
Bear Scenario
Trigger: Core CPI m/m prints at 0.3% or above → Gold breaks $4,382 on the 15-minute chart → Target: $4,362–$4,356 demand zone. A sustained break below $4,356 on a daily close would mark the first structural shift in the near-term trend, opening a deeper retracement toward $4,320.
Events Ahead This Week
- Wed Aug 12, 3:30 PM UTC+3 — US Core CPI m/m (forecast 0.2%) and CPI y/y (forecast 3.4%): The primary gold catalyst for the week; a soft print drives rate cut expectations and lifts XAU/USD.
- Wed Aug 12, 5:30 PM UTC+3 — US Crude Oil Inventories (forecast -1.7M): A large draw could complicate the inflation narrative but is a secondary factor for gold today.
- Wed Aug 12, 8:01 PM UTC+3 — US 10-Year Bond Auction (prior 4.58|2.6): Weak demand raises real yields and could cap post-CPI gold gains; strong demand reinforces the bid.
- Thu Aug 14 — US Retail Sales and PPI: The second major macro catalyst block of the week; weak retail sales would amplify any dovish CPI signal and extend gold’s rally.
For full weekly macro context and the week’s trade framework, see the Gold Week Ahead: August 10–14, 2026 hub. For yesterday’s pre-CPI positioning analysis, see XAU/USD Pulls Back from $4,440 High — CPI Eve Keeps Bullish Bias Intact.
New York Session Update
Price Check
Gold has validated the morning’s bullish thesis in full, surging from $4,394 to a session high of $4,438 before consolidating at $4,434 as the New York session opens. The $4,430 target identified in Gold Compass Daily’s morning analysis has been reached and exceeded within hours of the CPI release.
What Changed
The August CPI print delivered the soft outcome gold needed. Headline CPI m/m came in at -0.1% against a 0.1% forecast — the first negative monthly reading in years — while the y/y figure printed at 2.7%, well below the 3.4% consensus. Core CPI m/m matched expectations at 0.2%, down from June’s 0.0% base effect distortion, but the headline miss was sufficient to reprice Fed rate cut expectations sharply lower on the dollar and real yield side. XAU/USD broke through $4,410 resistance within the first 15-minute candle post-release, then continued through $4,419 and $4,422 with minimal resistance, printing a session high of $4,438 before the current consolidation phase near $4,434.
Updated Levels
- Current price: $4,434
- Bias now: Bullish — strengthened; CPI catalyst confirmed directional move
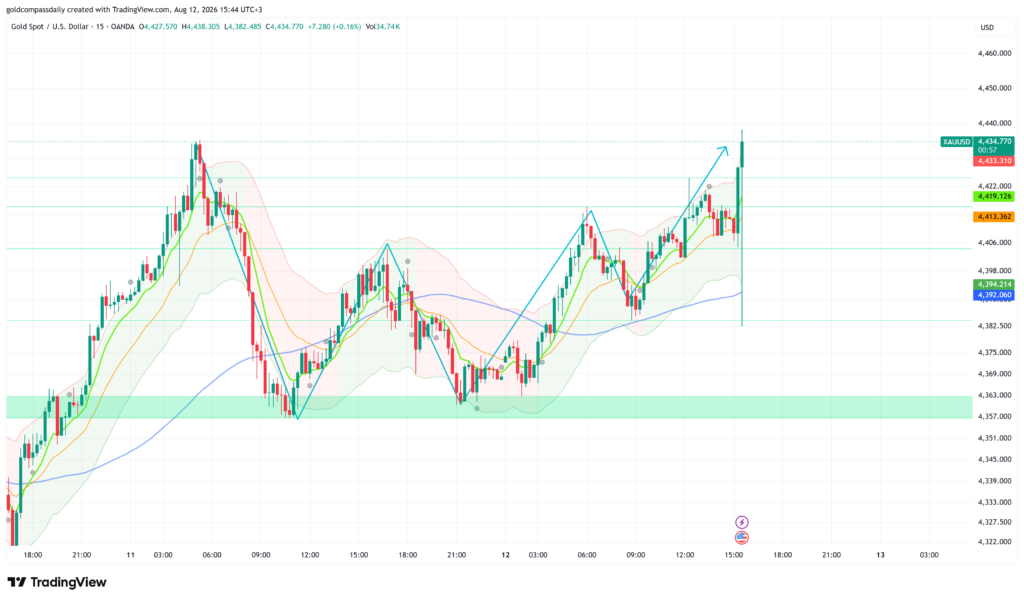
- Updated support: $4,419 → $4,413 → $4,392
- Updated resistance: $4,438 (session high) → $4,450 → $4,460
- NY session target: $4,450 on a clean break and hold above $4,438
Scenarios Into the Close
Bull: Price holds above $4,419 on any pullback and reclaims $4,438 → extension toward $4,450 into the close. Bear: Rejection at $4,438 with a break below $4,413 on the 15-minute chart → retracement to $4,392–$4,394, which now becomes the key support reclaim level.
Chart Analysis
The 15-minute chart as of 15:44 UTC+3 shows a near-vertical impulse candle driving price from the $4,392–$4,394 consolidation zone to $4,438 on the CPI release — the session’s defining structural move. The annotated projection on the chart points toward continued upside beyond $4,438, consistent with the broader bullish channel that has been in place since the August 11 low at $4,357–$4,363. The green demand zone at $4,357–$4,363 remains the structural floor and has not been tested since the recovery began. Short-term MAs (green and orange) have turned sharply higher and are now stacked bullishly beneath price, with the slower blue MA at approximately $4,392 providing the deeper dynamic support level on any pullback. The $4,419 level — a prior intraday resistance that was broken cleanly on the CPI spike — now flips to the first meaningful support on a retest. Consolidation at $4,434 is constructive; the absence of a sharp reversal candle suggests the market is digesting the move rather than distributing. A 15-minute close above $4,438 opens the path toward the $4,450 level visible in the upper chart structure.
Analysis based on the XAU/USD 15-minute chart as of August 12, 2026, 08:41 UTC+3. This article is for informational and educational purposes only and does not constitute financial advice.