

Gold enters the week of August 10–14, 2026 at approximately $4,316 — recovering from a week that saw prices soften before buyers surged back with force, driving an impulsive rally through the $4,200s and printing a fresh multi-week high near $4,341 on Friday, August 9. The defining theme for the week ahead is US inflation data: Wednesday’s CPI print will either validate gold’s breakout and open the path toward $4,380, or deliver a hawkish surprise that forces a retest of the $4,236–$4,260 support band. The technical structure is constructively bullish, the macro tailwinds remain in place, but the week’s event calendar carries enough firepower to produce a significant directional resolution in either direction.
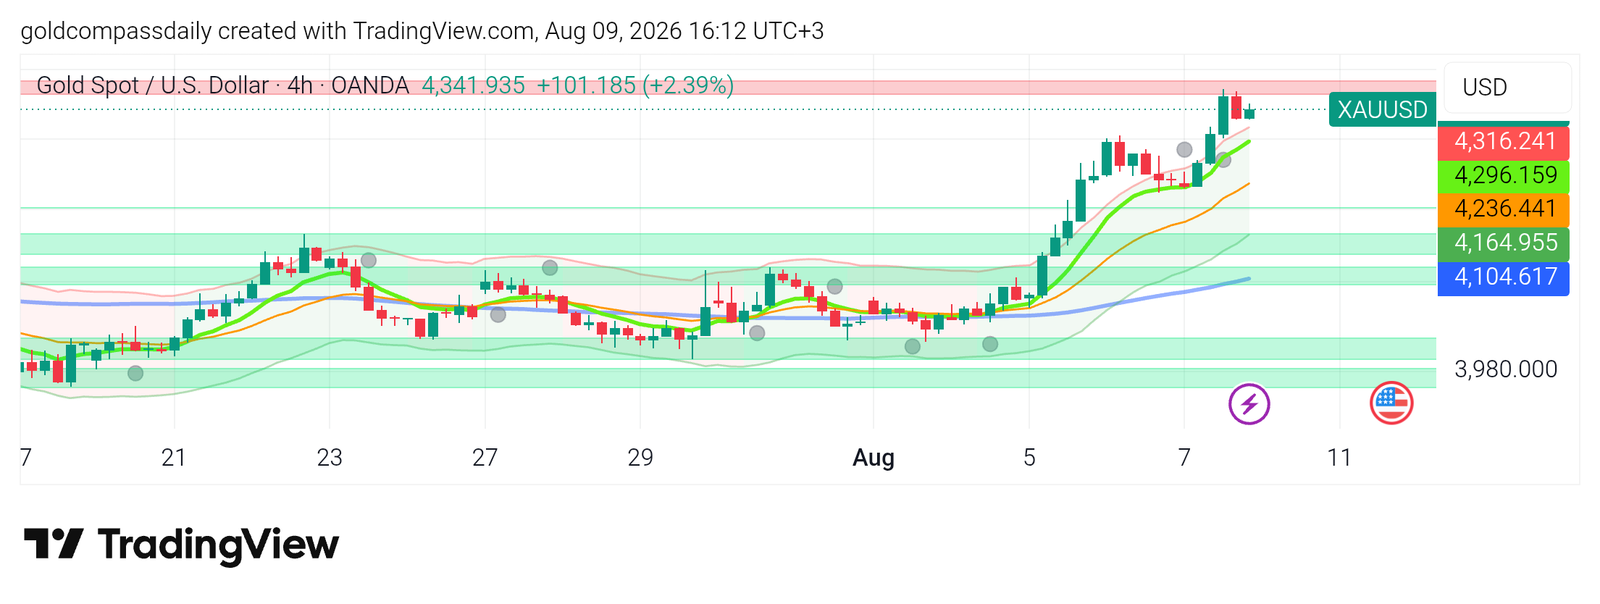
Key Levels for the Week
- Weekly bias: Bullish above $4,260 — bears need a daily close below this level to challenge the trend
- Key support: $4,296 (fast MA / immediate intraday floor) → $4,236 (medium MA and prior consolidation zone) → $4,164 (structural support band)
- Key resistance: $4,341 (Friday session high / current breakout test) → $4,380 (chart ceiling, dotted resistance line) → $4,420+ (open air if $4,380 clears on volume)
- Weekly bull target: $4,380–$4,400 (conditional on a soft CPI print and Retail Sales miss)
- Weekly bear risk: $4,164 (conditional on a CPI surprise and hawkish Fed response)
- The floor: $4,104 — a break and daily close below this level signals structural deterioration and a potential return toward $3,980
The Week’s Defining Event
Wednesday’s US CPI release — scheduled for 3:30 PM UTC on August 13 — is the single event that will define gold’s direction for the week of August 10–14. The Federal Reserve under Chair Kevin Warsh has remained data-dependent, and a meaningful upside surprise in either headline or core inflation would reignite expectations for a more prolonged pause in the rate cycle, strengthening the US dollar and applying direct pressure on XAU/USD from the yield side. Conversely, a softer-than-expected CPI print — particularly if Core CPI m/m prints at or below 0.2% — would reinforce the disinflationary narrative that has helped gold sustain its advance through mid-2026, removing a key technical obstacle and opening the door for a test of $4,380 and beyond. Every other event this week, including Friday’s Retail Sales figures and the RBA decision on Tuesday, orbits Wednesday’s inflation data as the gravitational center of the week’s price action.
Macro Context
Gold’s technical position entering this week is the strongest it has been in several weeks. After consolidating through late July in a defined $4,030–$4,200 range, buyers broke structure convincingly during the first week of August, printing a series of higher highs and higher lows on the 4-hour chart that reasserted bullish control. The move from the early-August base near $4,030 to Friday’s high near $4,341 represents a gain of approximately $310 inside five trading sessions — an expansion that has stretched all three visible moving averages in a full bull stack: the fast MA (green) now resides near $4,296, the medium MA (orange) near $4,236, and the slower MA (blue) near $4,104. All three are rising in unison, a configuration that historically favors continuation rather than reversal on the first retest.
The macro forces underpinning gold’s move remain largely intact. Global central bank demand — which has been a structural bid beneath gold through much of 2025 and 2026 — continues to provide a floor under any sharp dips. On the monetary policy side, markets have been repricing Federal Reserve expectations in gold’s favor: with inflation data showing signs of incremental softening through much of the first half of 2026, the probability of a Fed rate cut before year-end has risen gradually, compressing real yields and diminishing the opportunity cost of holding gold. Additionally, persistent geopolitical uncertainty and dollar index softness through much of Q2 and into Q3 2026 have acted as tailwinds that keep safe-haven flows directed toward XAU/USD. The question entering this week is not whether the structural bull case remains valid — it does — but whether Wednesday’s CPI print confirms the market’s current dovish lean or disrupts it.
From a Fed communication standpoint, the week also carries two FOMC member appearances: Hammack speaks Thursday at 3:15 PM UTC and Barkin follows at 3:40 PM UTC — both on the same day as PPI data, creating a concentrated Thursday risk window. Any language from either speaker that signals discomfort with current financial conditions or resistance to near-term cuts would compound a hawkish CPI reaction. Conversely, any reference to progress on the inflation mandate would be read as reinforcing the current trajectory and likely add fuel to a CPI-driven gold rally. Gold Compass Daily notes that the combination of CPI on Wednesday and dual Fed speakers on Thursday — sandwiched around UK GDP data in the early Thursday session — makes the mid-week window the highest-risk, highest-opportunity period of the week.
Daily Event Calendar: August 10–14, 2026
Monday, August 10
- 2:50 AM UTC — JPY — Bank Lending y/y / BOJ Summary of Opinions / Current Account: The BOJ Summary of Opinions carries the most gold relevance — any language reinforcing the BOJ’s gradual tightening path would support the yen and add marginal safe-haven pressure, though direct gold impact is typically limited on this release alone.
- 8:00 AM UTC — JPY — Economy Watchers Sentiment: Low direct impact on gold; monitors domestic Japanese economic mood. Watch for JPY volatility only if the print diverges sharply from consensus.
- 11:30 AM UTC — EUR — Sentix Investor Confidence: A proxy for European investor risk appetite; a notably weak print could support gold’s safe-haven bid as European institutional sentiment deteriorates.
- Tentative — USD — Cleveland Fed Inflation Expectations: A forward-looking inflation gauge that will begin priming markets for Wednesday’s CPI. A rise in expectations would modestly strengthen the dollar and pressure gold in thin Monday trade.
Tuesday, August 11
- All Day — JPY — Bank Holiday: Reduced JPY liquidity; Asian session may see thinner-than-usual conditions affecting gold’s early pricing.
- 7:30 AM UTC — AUD — Cash Rate / RBA Rate Statement / RBA Monetary Policy Statement: The RBA decision is Tuesday’s headline event. Any unexpected cut or dovish pivot could weaken the AUD and reflect a broader global softening bias, which typically supports gold’s safe-haven demand. A hold with hawkish language would have minimal direct gold impact but could signal global central bank divergence.
- 8:30 AM UTC — AUD — RBA Press Conference: Governor Bullock’s tone on inflation and the growth outlook carries more forward-guidance weight than the rate decision itself; watch for any reference to global uncertainty, which often provides a supporting narrative for gold.
- 1:00 PM UTC — USD — NFIB Small Business Index: A deterioration in small business confidence would add to evidence of a softening US economy — historically a constructive setup for gold.
- 3:15 PM UTC — USD — ADP Weekly Employment Change: A weaker-than-expected private payrolls print would reinforce the case for Fed easing and support gold into Wednesday’s CPI.
- 5:00 PM UTC — USD — Existing Home Sales: Secondary impact; significant only if combined with other softer data to build a broad US economic slowdown narrative.
Wednesday, August 12
- 9:00 AM UTC — EUR — German Final CPI m/m: A downside revision to German inflation would add to a global disinflation narrative and pre-position gold positively ahead of US CPI later in the session.
- 3:30 PM UTC — USD — Core CPI m/m / Core CPI y/y / CPI m/m / CPI y/y: The week’s most critical event. Consensus expectations for Core CPI m/m hover near 0.2–0.3%. A print at 0.2% or below supports the gold bull case; a print at 0.4%+ would represent a hawkish shock and trigger XAU/USD selling toward $4,236. The year-over-year Core CPI figure will determine whether markets continue pricing Fed cuts or begin repricing a pause extension.
- 5:30 PM UTC — USD — Crude Oil Inventories: Secondary; monitors energy-inflation linkage that could color CPI interpretation in post-release commentary.
- 8:01 PM UTC — USD — 10-Year Bond Auction: A weak auction (rising yields) post-CPI would compound any hawkish reaction, amplifying selling pressure on gold. A strong auction (falling yields) post-soft-CPI would accelerate gold’s upside move.
Thursday, August 13
- 9:00 AM UTC — GBP — GDP m/m / Prelim GDP q/q / Industrial Production m/m / Manufacturing Production m/m: UK GDP is the European morning’s key release. A GDP beat would strengthen sterling and contribute to a broadly risk-positive session; a miss would add to global slowdown concerns supporting gold.
- 3:15 PM UTC — USD — FOMC Member Hammack Speaks: Post-CPI Fed communication is critical — Hammack’s reaction to Wednesday’s inflation data will be closely parsed for any shift in the rate path narrative. Hawkish language following a hot CPI would compound gold’s selling pressure.
- 3:30 PM UTC — USD — Core PPI m/m / PPI m/m / Unemployment Claims: PPI data provides the pipeline inflation signal. If Core PPI also runs hot after a hot CPI, gold faces a compounding headwind. Initial Jobless Claims will calibrate the labor market narrative — a rise in claims would support the growth-slowdown case and partially offset inflationary concerns for gold.
- 3:40 PM UTC — USD — FOMC Member Barkin Speaks: A second FOMC voice on the same afternoon as PPI and Jobless Claims creates an unusually dense risk window. Back-to-back Fed speakers with fresh inflation and labor data in hand could trigger outsized volatility in gold.
- 8:01 PM UTC — USD — 30-Year Bond Auction: If Wednesday’s 10-year auction was soft, a Thursday 30-year auction result will confirm or deny whether bond market selling is sustained — a meaningful read for real yield direction and therefore gold.
Friday, August 14
- 2:30 AM UTC — AUD — RBA Gov Bullock Speaks: Post-decision commentary from the Governor may offer additional nuance following Tuesday’s rate decision; watch for any explicit language on global risks that could provide a gold-supportive narrative into the European open.
- 12:00 PM UTC — EUR — Flash GDP q/q / Flash Employment Change q/q / Trade Balance: Eurozone GDP flash estimates for Q2 2026 could move EUR/USD meaningfully, which carries inverse implications for the dollar index and therefore gold. A disappointing Eurozone GDP print that coincides with a soft US Retail Sales result would be a strongly constructive combination for XAU/USD into the weekend.
- 3:30 PM UTC — USD — Core Retail Sales m/m / Retail Sales m/m: Friday’s second major event of the week. Retail Sales weakness would reinforce the US consumer slowdown narrative and build the case for Fed cuts — a direct gold tailwind heading into the weekend close. A strong print would partially offset any dovish CPI momentum built earlier in the week.
- 5:00 PM UTC — USD — Prelim UoM Consumer Sentiment / Prelim UoM Inflation Expectations: The University of Michigan’s inflation expectations component is increasingly watched by Fed officials. A rise in 1-year inflation expectations despite soft CPI data would complicate the dovish narrative and could cap gold’s Friday gains. Consumer Sentiment below 65 would add to the growth-concern backdrop supporting gold.
Weekly Bull and Bear Scenarios
Bull Case
Gold’s bull case for the week of August 10–14 is activated by a combination of soft US CPI data on Wednesday (Core CPI m/m at or below 0.2%), neutral-to-dovish language from FOMC members Hammack and Barkin on Thursday, and a weak Retail Sales print on Friday. Under this scenario, XAU/USD consolidates above $4,296 through Monday and Tuesday before breaking above $4,341 on Wednesday’s CPI release. The 10-year bond auction holding well post-CPI would validate the rally, with price pushing through the $4,380 chart ceiling during the Thursday–Friday window. Gold Compass Daily’s bull target under this combination of events is $4,380–$4,400, with a close above $4,380 on Friday signaling a potential acceleration toward all-time high territory in the following week. The fast MA at $4,296 and medium MA at $4,236 define the support structure that must hold for the bull case to remain valid.
Bear Case
The bear case is triggered by a hot CPI print on Wednesday — Core CPI m/m at 0.4% or above — which would force a repricing of Fed cut expectations and drive a sharp USD bid. Under this scenario, XAU/USD sells off through $4,296 and tests the $4,236 medium MA during Wednesday’s US session. If the 10-year bond auction delivers a weak result and Thursday’s PPI data also runs above consensus, gold faces a compounding fundamental headwind. FOMC member hawkish commentary on Thursday afternoon would confirm the shift, and price would target $4,164 as the next meaningful support. Gold Compass Daily’s bear downside risk for the week is $4,164, with a sustained break and daily close below $4,236 being the trigger that confirms the bearish scenario is in motion. A close below $4,104 — which aligns with the slow MA — would be a more severe signal suggesting the August recovery rally has fully reversed.
This Week’s Daily Analysis
- Monday, August 10 — Gold opens the week consolidating near $4,316 as markets digest Friday’s sharp rally to $4,341. The BOJ Summary of Opinions and Cleveland Fed Inflation Expectations set the tone for a macro-light session, with attention already turning to Wednesday’s CPI data. Price action expected to remain range-bound between $4,296 and $4,341 absent a major surprise from either the Japanese central bank commentary or the US inflation expectations release.
- Tuesday, August 11 — The RBA rate decision and press conference dominate Tuesday’s macro calendar. A Japanese bank holiday reduces Asian liquidity. Gold’s near-term positioning will be shaped by whether ADP employment data and NFIB small business confidence add to or detract from the US softening narrative building ahead of Wednesday.
- Wednesday, August 12 — CPI day. The most important session of the week. German CPI data in the European morning sets the disinflation tone, with the full focus shifting to the US Core CPI at 3:30 PM UTC. The 10-year bond auction result in the evening will determine whether any CPI-driven move is sustained or fades into the close.
- Thursday, August 13 — A dense risk session combining UK GDP in the European morning with Core PPI, Unemployment Claims, and dual FOMC speakers in the US afternoon. The 30-year bond auction in the evening provides a final read on bond market sentiment before Friday’s data.
- Friday, August 14 — Eurozone GDP flash estimates in the European morning, followed by US Retail Sales and University of Michigan Consumer Sentiment and Inflation Expectations in the afternoon. Friday’s combination of data will determine whether gold holds its weekly gains or faces late selling pressure into the weekend close.
Chart Structure and Technical Outlook
The 4-hour XAU/USD chart as of August 9, 2026 presents one of the cleaner bullish setups of the past several weeks. The price structure since early August shows a textbook impulsive advance: a base near $4,030 in late July and early August, followed by a series of higher highs and higher lows that have now pushed gold to a session high of $4,341.935. At the time of this writing, price has pulled back slightly to $4,316, which is consistent with normal consolidation after an extended move — not a reversal signal in isolation.
All three visible moving averages are in a full bull stack: the fast MA (green) resides near $4,296 and is rising steeply, the medium MA (orange) has lifted to approximately $4,236 and is accelerating upward, and the slow MA (blue/purple) at $4,104 is beginning to turn higher after weeks of lateral drift. When all three moving averages are aligned in ascending order with price trading above all of them — as is currently the case — the historical tendency is for dips to be bought rather than sold, and for the trend to persist until a fundamental catalyst disrupts it. That catalyst, this week, is Wednesday’s CPI.
The green horizontal band zones visible across the chart correspond to layered support and resistance built over the past several weeks of price action. The immediate resistance at $4,341 is the Friday high and represents the last barrier before open air toward the dotted resistance line near $4,380. Below price, the $4,296 fast MA and the $4,236 medium MA define the two-step support structure that bulls need to defend for the weekly uptrend to remain intact. Beneath $4,236, the $4,164 zone has served as a key structural level during the early-August consolidation. A break below $4,104 — the slow MA — would require a reassessment of the bullish structure entirely.
The overall technical read is bullish on any timeframe visible on this chart. Price is above all moving averages, moving averages are stacked in ascending order, and the recent advance has been steep and sustained — characteristics associated with institutional participation rather than retail speculation. The primary risk this week is a macro shock that disrupts the momentum from the fundamental rather than the technical side.
Analysis based on the XAU/USD 4-hour chart as of August 9, 2026, 16:12 UTC+3 (OANDA). This article is for informational and educational purposes only and does not constitute financial advice.