

Gold trades cautiously bullish at $4,319 after printing a session low of $4,311, with the metal under sustained selling pressure following the week’s macro data releases. The immediate focus shifts to U.S. Retail Sales and the preliminary University of Michigan Consumer Sentiment reading, both due in the afternoon session, which carry direct implications for the Fed rate path and gold’s near-term recovery potential.
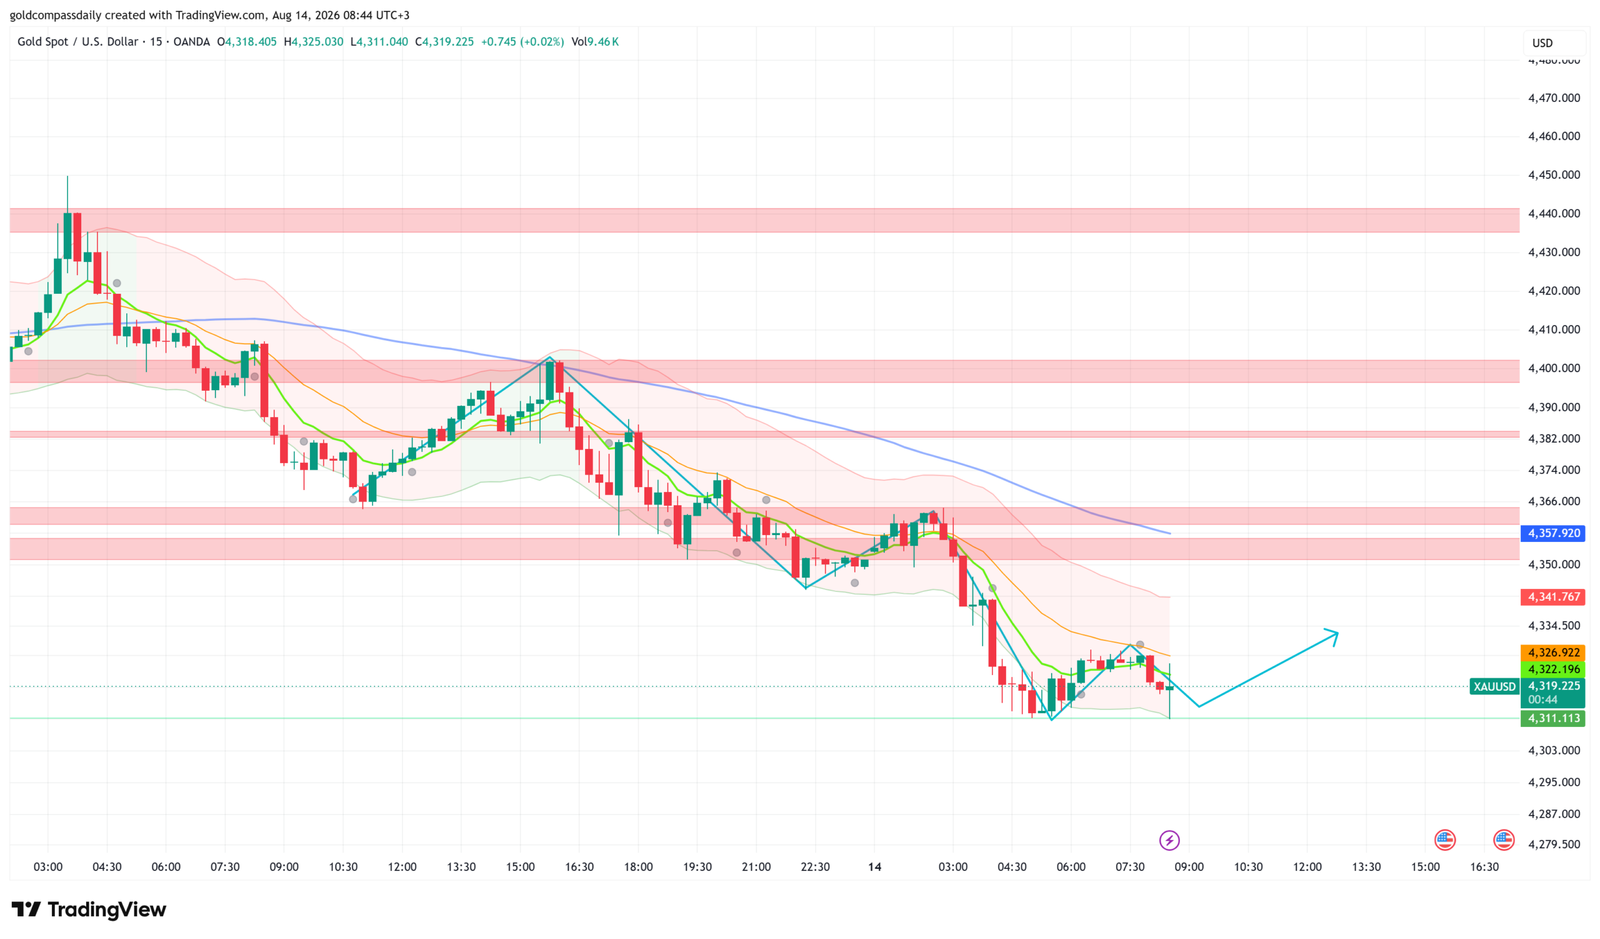
Key Levels
- Bias: Cautiously Bullish — recovery thesis valid above $4,311 session low
- Support: $4,311 (session low) → $4,295 (structural extension)
- Resistance: $4,327 → $4,342 → $4,358 → $4,382
- Session target: $4,342–$4,358 (conditional on soft Retail Sales and weak UoM Sentiment)
- Invalidation: Below $4,305 — opens the path toward $4,279–$4,287
Catalyst of the Day
The dual release of U.S. Core Retail Sales and Retail Sales at 3:30 PM UTC+3 represents the primary catalyst for today’s session. Core Retail Sales are forecast at +0.2% month-on-month against a prior reading of −0.2%, while headline Retail Sales are expected at +0.1% following +0.2% previously. A reading that misses on both figures — particularly a continuation of weakness in core consumption — would reinforce the case for Federal Reserve easing and deliver a direct bid to gold. Conversely, a beat on either metric would validate the week’s dollar-positive narrative and pressure XAU/USD toward and potentially through the $4,311 session low. The follow-through read comes at 5:00 PM UTC+3 with the preliminary University of Michigan Consumer Sentiment index, forecast at 54.7, and the accompanying Inflation Expectations component, previously at 4.2%. Elevated inflation expectations alongside weak sentiment is the most bullish combination for gold — it signals stagflationary pressure that reduces the Fed’s room to tighten further.
Fundamental Context
Gold has shed roughly $130 from the $4,452 rejection high recorded on Monday, with the week’s macro releases delivering a consistent message: the U.S. economy retains enough resilience to keep the Federal Reserve on hold longer than markets had priced. Thursday’s Producer Price Index and Initial Jobless Claims data continued that theme, capping any recovery attempts in gold. Fed Chair Kevin Warsh has maintained a cautious posture on rate cuts, and the data flow this week has reinforced that stance. For gold, every dollar-positive data surprise delays the rate-cut catalyst that has been a primary driver of the metal’s multi-month advance toward institutional targets of $5,200 (Morgan Stanley), $5,400 (Goldman Sachs), and approximately $6,000 (JPMorgan).
Eurozone data released earlier today provided a marginal offset. Flash GDP for the second quarter came in at +0.4% quarter-on-quarter in line with forecasts, while the Trade Balance improved to −2.2 billion euros against a prior reading of −5.0 billion — suggesting the Eurozone’s external position is stabilizing. These figures modestly weaken the dollar’s relative safe-haven appeal but are insufficient on their own to reverse gold’s intraday bias. The decisive input remains U.S. consumer data. Today’s Retail Sales and UoM releases are the final macro events of the week, making them disproportionately influential on Friday’s price action and the closing tone heading into the weekend.
Chart Analysis
The XAU/USD 15-minute chart as of 08:44 UTC+3 shows price trading at $4,319 after marking a session low of $4,311 — the lowest level seen this week. The sell-off from the $4,400 rejection at 15:30 yesterday has been sharp and structured, with price cascading through the $4,382, $4,366, and $4,357 resistance bands now functioning as overhead supply. All three moving averages — the short-term green MA, the medium-term orange MA, and the long-term blue MA — are bearishly aligned and descending, with price trading below all three. The Bollinger Bands are expanded and price is pressed against the lower band, indicating oversold short-term conditions on the 15-minute timeframe. A projected recovery arc visible on the chart targets a return toward the $4,341–$4,358 resistance cluster, consistent with the buy bias, but no bullish structural confirmation exists yet. Price must reclaim and hold above $4,327 on a closing candle basis to begin building a credible recovery case. The $4,341.767 level — marked on the chart — represents the first meaningful overhead test; clearing it opens the door to $4,357–$4,358. Failure to hold $4,311 on any retest shifts the structural picture decidedly bearish toward the $4,287–$4,279 zone.
Bull / Bear Scenarios
Bull Scenario
Trigger: U.S. Core Retail Sales misses at or below 0.0% m/m AND UoM Consumer Sentiment prints below 54.0 with Inflation Expectations holding at or above 4.2%.
Path: Price reclaims $4,327 → advances to $4,342 → targets $4,358 resistance band on strong volume. A close above $4,358 on the 15-minute chart would open the door to $4,382.
Bear Scenario
Trigger: U.S. Core Retail Sales beats at +0.3% or above, reinforcing the dollar-positive narrative from earlier in the week.
Path: Rejection at $4,327–$4,342 resistance cluster → renewed pressure on $4,311 session low → break below $4,305 targets $4,287 and potentially $4,279 structural support.
Events Ahead
- Friday, Aug 14 — 3:30 PM UTC+3 — U.S. Core Retail Sales m/m (forecast: +0.2%, prior: −0.2%): The primary gold catalyst of the session; a miss pressures the dollar and supports a recovery bid in XAU/USD.
- Friday, Aug 14 — 3:30 PM UTC+3 — U.S. Retail Sales m/m (forecast: +0.1%, prior: +0.2%): Headline consumer spending data; a second consecutive miss would amplify gold’s recovery potential.
- Friday, Aug 14 — 5:00 PM UTC+3 — Prelim UoM Consumer Sentiment (forecast: 54.7, prior: 55.2): Declining sentiment combined with sticky inflation expectations is the stagflationary signal most supportive of gold demand.
- Friday, Aug 14 — 5:00 PM UTC+3 — Prelim UoM Inflation Expectations (prior: 4.2%): Any uptick above 4.2% while sentiment deteriorates reinforces the gold bull case through the stagflation channel.
- Friday, Aug 14 — 5:00 PM UTC+3 — U.S. Business Inventories m/m (forecast: +0.2%, prior: +0.3%): Secondary data point; relevant only if Retail Sales also miss, as it would deepen concerns about demand-side softness.
For the weekly macro framework underpinning today’s session, see the Gold Week Ahead: August 10–14, 2026 hub. For Thursday’s analysis covering the PPI and Claims data that preceded today’s move, see Gold Slips to $4,397 After $4,452 Rejection — PPI and Claims in Focus.
London Session Update
Price Check
Gold has recovered to $4,342 from the $4,311 session low established in the early Asian session, with the morning analysis’ cautiously bullish thesis holding — price found support precisely at the flagged low and has since staged a measured recovery. The original buy bias has not been invalidated, though the structure remains fragile ahead of the U.S. session catalysts.
What Changed
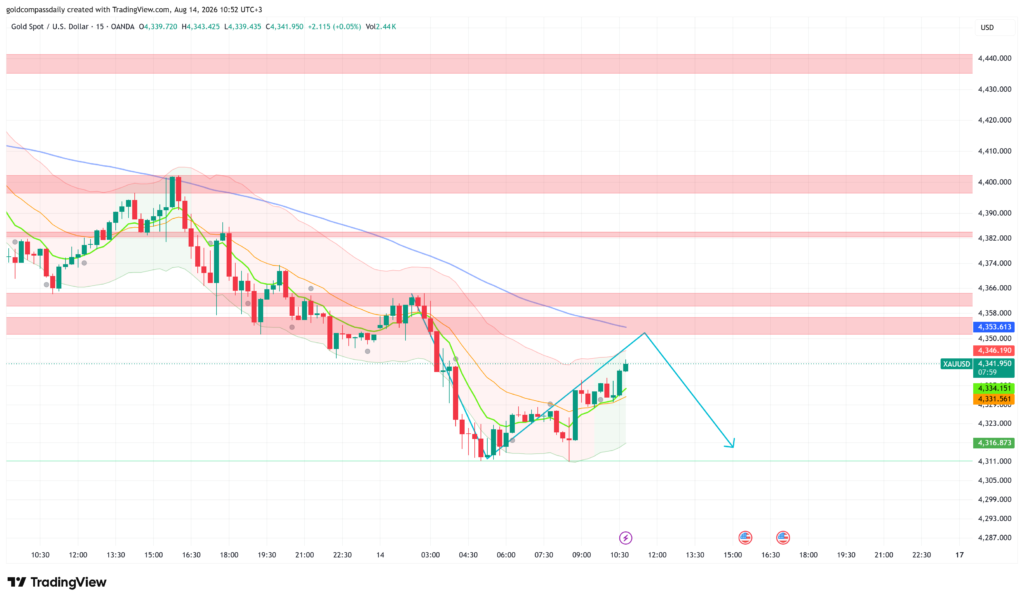
The London open introduced a short but sharp rejection off the $4,358 resistance zone, with price retreating back to the $4,331–$4,334 area before recovering again into the current $4,342 handle. That sequence — rejection, pullback, and re-bid — is characteristic of institutional buy-side interest testing the water ahead of the afternoon data releases. No new European macro data materially altered the picture: Eurozone Flash GDP and Trade Balance confirmed earlier at-consensus readings (GDP +0.4% q/q, Trade Balance −2.2 billion euros), contributing nothing directionally new for gold. The relevant shift is purely structural — price has built a short-term base above the $4,311 low, and the 15-minute chart now shows a tentative bullish MA cross, adding a technical layer to the fundamental recovery case. The decisive input — U.S. Retail Sales and UoM Consumer Sentiment — remains ahead, and the London session has effectively set the range from which the New York break will occur.
Updated Levels
- Current price: $4,342
- Bias now: Cautiously bullish — unchanged, but conditional on holding $4,331 on any pullback
- Updated support: $4,334 → $4,331 → $4,316
- Updated resistance: $4,346 → $4,354 → $4,358 → $4,366
- London session target: $4,354 (upper resistance band) — conditional on consolidation holding above $4,334 into the NY open
Scenarios into the NY Handoff
Bull: Price holds above $4,334 through the NY open and U.S. Core Retail Sales misses at or below +0.1% — triggers a break above $4,354 targeting $4,366 and the broader $4,382 overhead supply. Bear: Price fails to sustain above $4,346 and Retail Sales beats consensus — rejection from the $4,346–$4,354 resistance cluster drives a retest of $4,316 and risks a break below the $4,311 session low, as the projected path on the chart illustrates.
Chart Analysis
The XAU/USD 15-minute chart as of 10:52 UTC+3 shows price recovering to $4,341.950 after the Asian session low at $4,311, with a session high of $4,343.425 — just beneath the $4,346.190 resistance level marked on the chart. The short-term green MA has crossed above the medium-term orange MA, representing the first bullish moving average signal of the session, though the long-term blue MA remains descending and intersects with the $4,358 resistance band — confirming that level as the key structural ceiling before the NY open. Support is now layered at $4,334.151 and $4,331.561, with $4,316.873 as the last line before the $4,311 low. The Bollinger Bands are visibly contracting around current price, signalling a compression phase that typically resolves sharply into high-impact data. The projected path drawn on the chart depicts a bearish resolution — failure at $4,346–$4,354 and a return toward $4,316 — which represents the risk scenario Gold Compass Daily’s morning analysis flagged under a Retail Sales beat. Price must clear and close above $4,354 on the 15-minute timeframe to shift the chart structure from recovery to trend reversal.
New York Session Update
Price Check
Gold has surged to $4,374 as of 15:50 UTC+3, recovering more than $63 from the $4,311 session low — a full vindication of Gold Compass Daily’s morning buy thesis. The cautiously bullish bias has been confirmed, with price clearing every resistance level identified across both earlier updates: $4,327, $4,342, $4,354, $4,358, and $4,366, before spiking into the $4,382 resistance band on the New York open.
What Changed
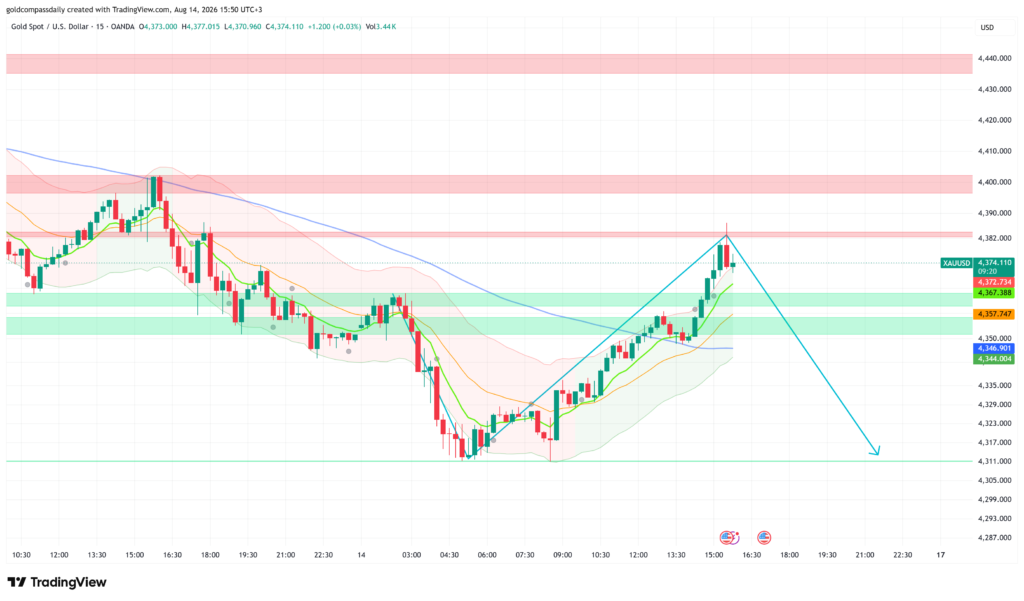
The catalyst was delivered precisely as the morning analysis outlined: U.S. Core Retail Sales for July missed consensus at −0.2% month-on-month against a forecast of +0.2%, and headline Retail Sales printed at −0.1% versus an expected +0.1% — both figures coming in below estimates and deepening the picture of a softening U.S. consumer. The preliminary University of Michigan Consumer Sentiment index declined to 50.8 against a forecast of 54.7 and a prior reading of 55.2, a sharper deterioration than anticipated. The accompanying Inflation Expectations component held at 4.2%. The combination — weakening consumption, collapsing consumer confidence, and sticky inflation expectations — delivered the stagflationary signal Gold Compass Daily’s morning analysis identified as the most bullish possible outcome for gold. The dollar sold off across the board on the data, providing direct fuel for the XAU/USD spike. Price tagged $4,377 intraday before a sharp rejection wick formed at the $4,382 resistance band, and gold is now consolidating just below that level in the $4,367–$4,375 range.
Updated Levels
- Current price: $4,374
- Bias now: Bullish — confirmed by data outcome, but watch for exhaustion at $4,382
- Updated support: $4,367 → $4,358 → $4,346
- Updated resistance: $4,382 → $4,400 → $4,440
- NY session target: $4,382 retest and close above — opens $4,400 into Monday’s open
Scenarios into the Close
Bull: Price consolidates above $4,367 and closes a 15-minute candle above $4,382 — opens the path toward $4,400 with continuation momentum into next week. Bear: Rejection at $4,382 holds and price loses the $4,357 support on a closing basis — the chart’s projected path targets a return toward $4,314–$4,311, unwinding a portion of the NY data-driven spike.
Chart Analysis
The XAU/USD 15-minute chart as of 15:50 UTC+3 shows price at $4,374.110, having printed a session high of $4,377.015 with a visible rejection wick into the $4,382 resistance band — the same level that capped price on Wednesday’s recovery attempt. The move from the $4,311 low has been impulsive and sustained, with the green short-term MA now firmly above the orange medium-term MA confirming bullish short-term structure. More significantly, price has broken above the descending blue long-term MA — a structural development not seen since the sell-off began on Monday — shifting the 15-minute chart from bearish trend to potential recovery mode. Support is now established at the $4,367.388 green band, with deeper support at $4,357.747 and $4,346.901. The projected path drawn on the chart is cautionary: it depicts a failure to sustain above $4,382, a controlled pullback to the $4,357–$4,367 support zone, followed by a sharper decline back toward the $4,311 area — the bear scenario into the close. For the bull case to remain intact, gold must digest the $4,382 rejection without surrendering the $4,367 level, and build a higher base from which to challenge $4,400 when New York trading resumes in full next week.
Daily Close Update
Price Check
Gold closes the August 14 session at $4,374, recovering approximately $63 from the $4,311 Asian session low and finishing the day near its intraday highs — a full confirmation of the morning buy thesis. The cautiously bullish bias outlined at the open, reinforced through the London update, and validated by the New York data catalyst, held across all three sessions without a single meaningful structural failure on the upside.
What Changed
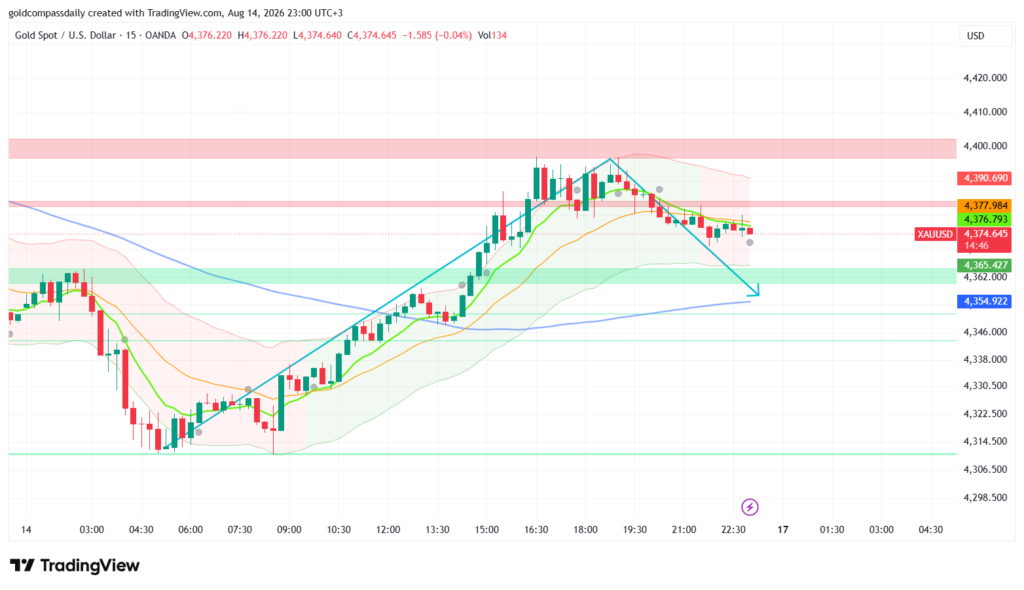
The final hours of the New York session introduced a controlled consolidation rather than the sharp reversal projected on the mid-session chart. After tagging the $4,400 resistance zone intraday — the primary ceiling identified in Gold Compass Daily’s morning analysis — price pulled back to the $4,374–$4,377 range and has remained anchored there into the close, with volume thinning significantly as the session wound down. No new macro catalysts emerged post-data; the afternoon’s price action was driven entirely by position adjustment following the Retail Sales and UoM Sentiment misses. U.S. Treasury yields softened on the weak consumption data, amplifying the dollar’s post-release decline and providing the fuel for gold’s push toward $4,400. The $4,400 band ultimately held as resistance — consistent with the structural level carried throughout the week — but the fact that price is closing in the $4,374 area rather than reversing toward $4,311 as the NY session chart’s projected path suggested indicates that the week’s broader sell-off from $4,452 has found a credible base. The close above the descending long-term moving average, which had capped all recovery attempts earlier in the week, represents the most significant structural development of the session heading into the weekend.
Daily Recap Levels
- Session high: ~$4,400 (intraday spike, 19:00–19:30 UTC+3)
- Session low: $4,311 (Asian session, confirmed from morning chart)
- Close price: $4,374
- Daily bias result: Confirmed — buy thesis held across all three session updates
- Key support (carried into Monday): $4,365 → $4,354
- Key resistance (carried into Monday): $4,378 → $4,390 → $4,400
Overnight / Next Session Watch
With no tier-one macro events scheduled for the Asian session on Monday morning, price action overnight will be driven by positioning flows and any weekend geopolitical developments that affect safe-haven demand. The chart’s projected path into the next session points toward a mild pullback to the $4,354–$4,365 support confluence — the blue long-term MA and the green support band — before any continuation higher. Bull: Price holds above $4,365 on the Monday open and builds a higher low — targets $4,390 and the $4,400 retest within the first London session. Bear: Weekend gap lower or Asian selling pressure breaks $4,354 on a closing basis — risks a retracement toward $4,338–$4,330 and questions whether the week’s base holds.
Chart Analysis
The XAU/USD 15-minute chart as of 23:00 UTC+3 captures the full narrative of August 14: a sharp Asian session flush to $4,311, a sustained recovery through London and into New York on the back of catastrophic U.S. consumer data, a spike toward $4,400 that was cleanly rejected, and a controlled consolidation into the close at $4,374.645. The session high of $4,376.220 on the current candle confirms that price has stabilized just beneath the $4,377.984 and $4,390.690 resistance labels visible on the chart. The green short-term MA remains above the orange medium-term MA — the bullish cross established mid-session has not been negated — while the blue long-term MA, now sitting near $4,354.922, has been reclaimed by price for the first time since Monday’s sell-off began. That MA reclaim is the structural headline of the day: it shifts the 15-minute chart from a bearish trend structure to a recovery structure. The projected path on the chart is a modest pullback to the $4,354–$4,362 support zone — a normal mean-reversion after the day’s $63 advance — followed by a continuation attempt. The $4,365.427 green band is the first defensive level; losing it on a Monday open would accelerate the pullback toward the blue MA at $4,354.922. Above, $4,390.690 and $4,400 define the ceiling that must be cleared for last week’s high at $4,452 to come back into play.
Analysis based on the XAU/USD 15-minute chart as of August 14, 2026 at 08:44 UTC+3. This article is for informational and educational purposes only and does not constitute financial advice.