

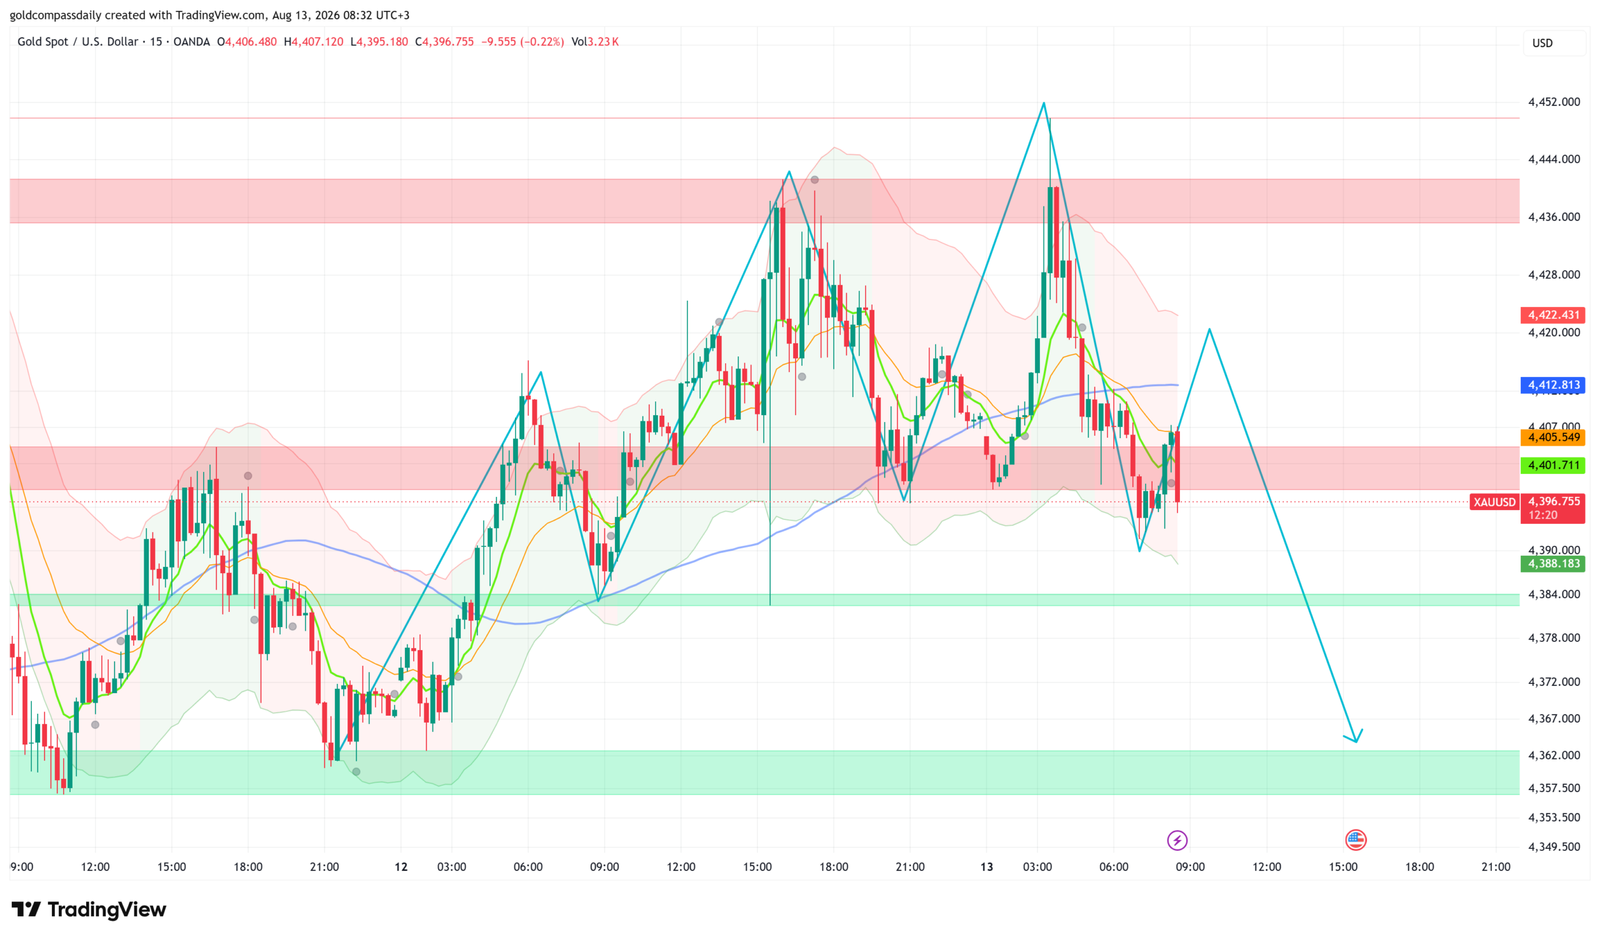
Gold trades cautiously bullish at $4,397 — still above key structural support but under pressure following a sharp rejection from the $4,452 session high. The pullback is technical in nature as markets position ahead of this afternoon’s US Producer Price Index and Unemployment Claims releases, which will determine whether yesterday’s post-CPI momentum can resume or whether a deeper retracement toward $4,362 unfolds first. Full week-ahead context is available in the Gold Compass Daily weekly hub.
Key Levels
- Bias: Cautiously Bullish above $4,384
- Support: $4,388 → $4,384 (green zone)
- Resistance: $4,401 → $4,412 → $4,422
- Session target (bull): $4,422–$4,430 on soft PPI and claims beat
- Session target (bear): $4,362–$4,357 on hot PPI surprise
- Invalidation: Below $4,384 on a closing basis = trend support broken, deeper correction toward $4,357 opens
Catalyst of the Day
The primary catalyst for Thursday’s session is the simultaneous release of US Core PPI (month-on-month), headline PPI, and Weekly Unemployment Claims at 3:30pm UTC+3. Yesterday’s softer-than-expected CPI print drove gold’s run to $4,452 — as covered in Wednesday’s analysis — and PPI now serves as the confirmatory data point for the inflation narrative. A headline PPI reading below the 0.2% forecast, combined with claims above 202K, would reinforce the disinflationary trend and revive Fed rate-cut pricing, directly pressuring real yields lower and providing the lift gold needs to recover above $4,412. Conversely, a PPI surprise to the upside — particularly in core — would challenge the CPI-driven narrative and accelerate today’s technical selling. Watch the 3:30pm print closely: the first 15 minutes of reaction will set the direction for the New York afternoon.
Fundamental Context
The macro backdrop remains structurally supportive for gold entering Thursday’s session. Wednesday’s US CPI data came in softer than expected, reinforcing expectations that the Federal Reserve under Chair Kevin Warsh faces a narrowing window to hold rates elevated. Lower inflation reduces the opportunity cost of holding non-yielding assets, and the gold market’s rally to $4,452 in the immediate aftermath was a direct expression of that dynamic. The question now is whether PPI — which measures input cost pressures upstream in the supply chain — corroborates the CPI picture or complicates it. A divergence, with PPI holding firm while CPI softens, would introduce uncertainty around the durability of disinflation and could cap any gold recovery.
Elsewhere, UK GDP data released this morning showed mixed signals — monthly GDP printed flat against a 0.0% forecast, while the preliminary quarterly reading came in at 0.4%, missing the 0.6% estimate. UK manufacturing production contracted 0.1% month-on-month against an expected 0.1% gain. These softer readings reinforce a global growth slowdown narrative that tends to support gold’s safe-haven bid over the medium term, even as they have limited direct impact on the dollar-denominated metal in intraday trading. The eurozone also reported a 0.1% monthly contraction in industrial production, adding to the pattern. Meanwhile, Japan’s PPI at 7.2% year-on-year — below the 7.4% forecast — signals easing producer-side inflation in Asia, consistent with the broader global disinflationary trend that has underpinned gold’s bull run through 2026.
Chart Analysis
The 15-minute XAU/USD chart on OANDA shows a clear two-leg structure over the past 48 hours: a rally from the $4,362 zone to the $4,452 overnight high, followed by a sharp rejection and retracement to the current $4,396 area. Price has broken back below the $4,401–$4,405 resistance band — now converted to resistance — and is consolidating just above the $4,388 support level marked on the chart. The Bollinger Bands have tightened following the sell-off, with the lower band now acting as a dynamic support guide near $4,388. The 200-period moving average (blue) is positioned around $4,388–$4,390, converging with the green support zone and making that area a critical line in the sand. Short-term moving averages (green and orange) have crossed bearishly in the recent candles, consistent with the corrective structure. The chart’s projected path — illustrated by the blue arrow — extends the bear leg toward $4,362–$4,357 if $4,384 fails to hold. For the bull case to reassert, price needs to reclaim $4,401 and hold, opening a path back toward $4,412 and the $4,422 resistance above.
Bull / Bear Scenarios
Bull Scenario
Trigger: US PPI (headline or core) prints below forecast and/or Unemployment Claims exceed 202K at 3:30pm UTC+3, gold reclaims $4,401 on a 15-minute closing basis.
Target: Initial move toward $4,412, extension toward $4,422–$4,430 into the New York afternoon session. A clean break of $4,422 re-opens the $4,452 prior high.
Bear Scenario
Trigger: PPI prints above forecast — particularly core above 0.3% — gold fails to hold $4,388 and breaks the $4,384 green zone on a closing basis.
Target: Accelerated move toward $4,362–$4,357, the lower boundary of the chart’s support band. A confirmed break opens $4,349 as the next structural level.
Events Ahead
- Thursday, Aug 13 — 3:15pm UTC+3: FOMC Member Hammack Speaks — any commentary on inflation trajectory or rate path timing directly affects Fed expectations and gold pricing.
- Thursday, Aug 13 — 3:30pm UTC+3: US Core PPI m/m (forecast 0.3%), PPI m/m (forecast 0.2%), Unemployment Claims (forecast 202K) — the primary catalyst for this session; a sweep of soft readings reopens the bull case for gold.
- Thursday, Aug 13 — 3:40pm UTC+3: FOMC Member Barkin Speaks — second Fed speaker of the session; watch for any policy signal that diverges from Hammack, creating volatility.
- Thursday, Aug 13 — 8:01pm UTC+3: US 30-Year Bond Auction (prior: 5.06%) — a weak auction drives yields higher and weighs on gold; a strong auction supports the Treasury bid and may pressure the dollar, aiding gold recovery.
- Friday, Aug 14: US Retail Sales and additional macro data close out the week’s macro calendar — the final data point for gold’s weekly thesis resolution.
London Session Update
Price Check
Gold has broken decisively lower since the morning analysis, trading at $4,370 — a drop of approximately $27 from the $4,397 level at publication. The cautiously bullish morning thesis has been invalidated: price sliced through the $4,384 structural floor that was identified as the critical line, triggering the bear scenario outlined earlier in the session.
What Changed
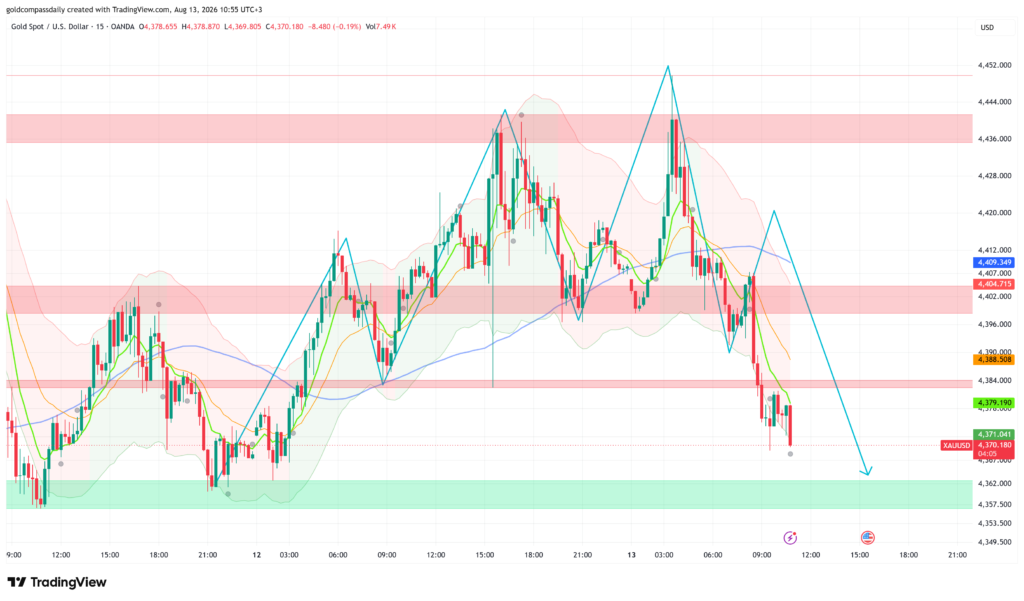
The breakdown accelerated through the London morning session as sellers absorbed the $4,388–$4,384 support zone without any meaningful bounce. The $4,379 level — the lower green band on the chart — failed to hold, and price is now pressing against the $4,371 area near the session low. No new high-impact data has printed since the morning open, which means this move is primarily technical and positioning-driven: the rejection from $4,452 has evolved from a routine pullback into a structured retracement, with the market unwinding post-CPI long exposure ahead of this afternoon’s PPI and Unemployment Claims. The 200-period moving average, which was converging with support near $4,388 in the morning, has been cleanly broken — a meaningful shift in near-term structure.
Updated Levels
- Current price: $4,370
- Bias now: Bearish — morning bull bias invalidated below $4,384; now neutral-to-bearish pending PPI
- Updated support: $4,362 → $4,357 (green zone floor)
- Updated resistance: $4,379 → $4,388 → $4,405
- London session target: $4,362–$4,357 if $4,371 fails to hold into the NY open
Scenarios Into the NY Handoff
Bull: US PPI prints soft (headline below 0.2%, core below 0.3%) at 3:30pm UTC+3 — gold reclaims $4,379 and targets $4,388 recovery, with $4,405 the ceiling for any meaningful bounce. Bear: PPI meets or beats forecast, $4,362 support fails on a 15-minute closing basis — extension toward $4,349–$4,357 opens with momentum sellers in control through the NY afternoon.
Chart Analysis
The 15-minute chart as of 10:55 UTC+3 shows XAU/USD in a clean impulsive leg lower from the $4,422 resistance zone, with price now at $4,370 — sitting just above the major green support band that spans $4,362–$4,357. The Bollinger Bands have expanded sharply to the downside, with price hugging the lower band, confirming active selling pressure rather than a consolidation structure. The 200-period moving average (blue line, ~$4,388) has been left well above current price and now acts as first resistance on any recovery attempt. Short-term moving averages (green and orange) are steeply angled lower and fanning out — no crossover recovery signal is present. The chart’s projected path (blue arrow) maintains the bear trajectory toward $4,362 and potentially $4,357 into the New York session, consistent with Gold Compass Daily’s morning bear scenario trigger. The key question for the NY open is whether the $4,362–$4,357 green zone attracts dip buyers ahead of the PPI print, or whether a data-driven break lower extends the retracement further.
New York Session Update
Price Check
Gold has staged a partial recovery to $4,394 after printing a session low of $4,365 during the London morning — the bear scenario from Gold Compass Daily’s morning analysis played out in full, with the $4,384 invalidation level breached and price flushing to the green support zone before finding buyers. The morning bull bias has been technically invalidated, though the recovery from $4,365 introduces a cautiously constructive setup heading into the New York afternoon.
What Changed
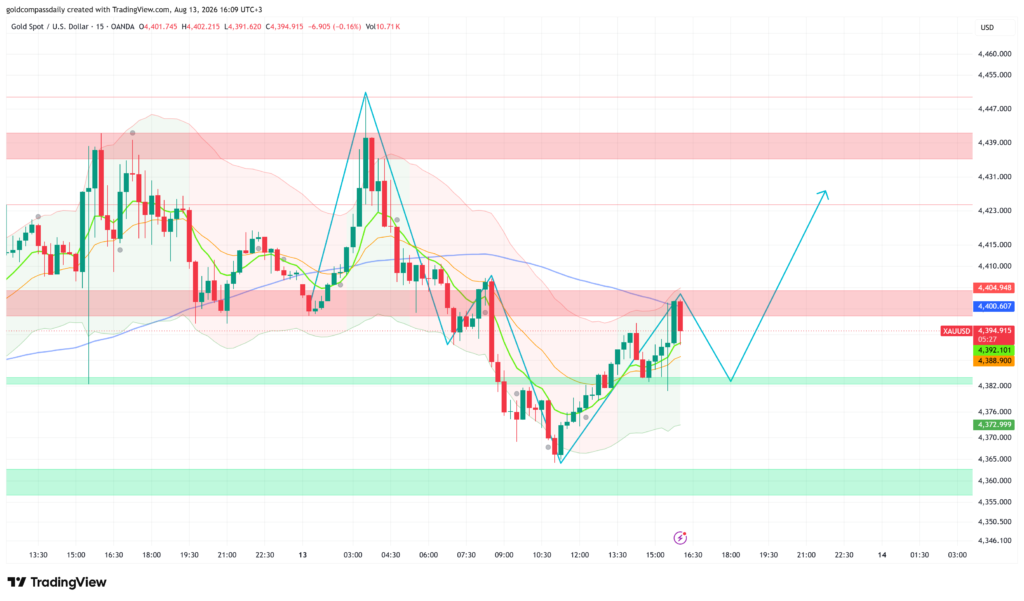
The primary catalyst for the intraday reversal was the US PPI and Unemployment Claims release at 3:30pm UTC+3. Headline PPI came in at 0.2% month-on-month against a prior reading of -0.3%, while Core PPI printed at 0.3% — in line with forecast but above the prior month’s 0.2%. Unemployment Claims came in at 202K, matching expectations. The data set was not soft enough to reignite aggressive Fed rate-cut pricing, but neither did it deliver the hawkish shock that would have extended the sell-off below $4,362. The net read for gold: a neutral-to-mildly-supportive macro print that allowed dip buyers to step in at the session low. Price has since recovered through $4,388 and is now consolidating in the $4,392–$4,400 band, with the $4,400–$4,405 resistance zone capping the initial bounce. FOMC Members Hammack and Barkin have both spoken this session; no material policy deviation from the established Fed narrative has been reported, leaving the technical structure as the dominant driver into the close.
Updated Levels
- Current price: $4,394
- Bias now: Neutral recovering to cautiously bullish — dip held at $4,365, recovery in progress but $4,400 must be reclaimed and held
- Updated support: $4,382 → $4,373 → $4,360
- Updated resistance: $4,400 → $4,405 → $4,423–$4,431 (red zone)
- NY session target: $4,423–$4,431 on a confirmed $4,400 break; $4,373 on rejection and re-test
Scenarios Into the Close
Bull: Price holds $4,388 on any pullback and closes a 15-minute candle above $4,405 — opens a path toward the $4,423–$4,431 resistance band into the New York close, with the chart’s projected recovery leg targeting that zone. Bear: $4,388 gives way on a closing basis and price re-tests $4,373 — the recovery structure fails and the session low at $4,365 comes back into play ahead of Friday’s Retail Sales data.
Chart Analysis
The 15-minute XAU/USD chart as of 16:09 UTC+3 shows a classic V-shaped recovery structure: a sharp impulsive leg from the $4,452 overnight high all the way to the $4,365 session low, followed by a steady recovery that has now brought price back to $4,394. The low was printed squarely within the green support band ($4,360–$4,382), confirming that zone as active demand. Price is currently consolidating just below the $4,400–$4,405 pink resistance band — the same zone that acted as support in the morning session before breaking down. The short-term moving averages (green and orange) have curled upward from the low and are beginning to converge, consistent with a developing recovery momentum. The 200-period moving average (blue) remains above current price near $4,415, acting as a medium-term ceiling. The Bollinger Bands are contracting after the volatile expansion lower, with the midline now near $4,392 — price trading at the midline confirms the neutral-to-recovering read. The chart’s projected path (blue arrow) shows a constructive recovery leg targeting the $4,423–$4,431 zone, contingent on $4,388 holding as the base and $4,405 being reclaimed. A failure to break $4,405 on this attempt opens a secondary dip before any continuation higher.
Daily Close Update
Price Check
Gold closes the August 13 session at approximately $4,350 — well below the $4,397 morning publication price and far from the cautiously bullish recovery scenario outlined at the open. The day’s narrative followed the bear script from start to finish: the morning invalidation at $4,384 triggered the London flush to $4,365, the New York bounce to $4,400 failed at resistance, and the final hours of the session saw a second leg lower that extended the sell-off to a session low of approximately $4,344. The day’s overall bias result is a clear bear confirmation.
What Changed
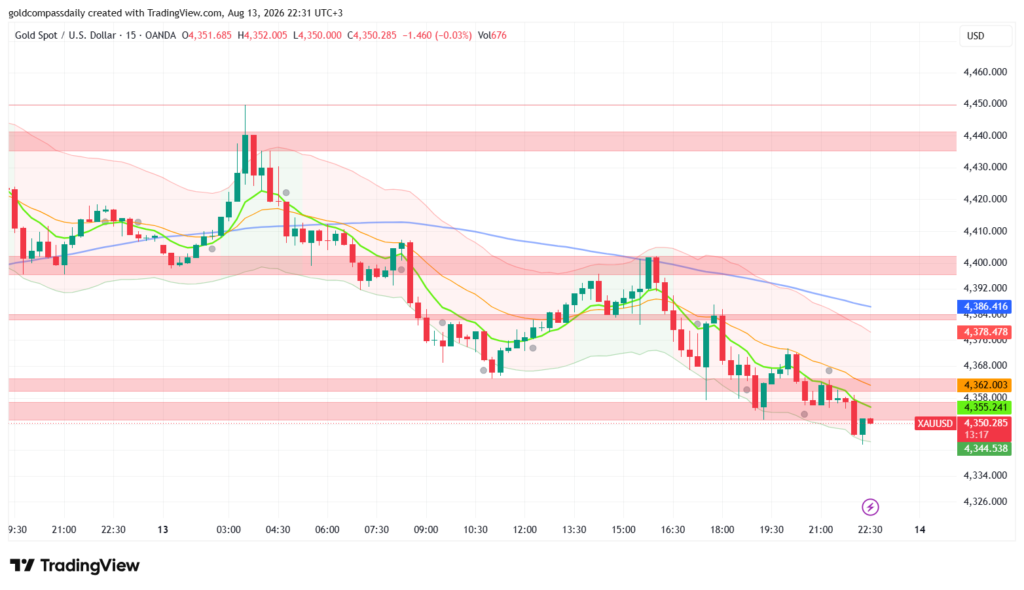
The New York session update noted a recovery attempt stalling at the $4,400–$4,405 resistance zone — that ceiling held precisely, and sellers reasserted control through the afternoon and into the evening hours. The 30-year Bond Auction at 8:01pm UTC+3 (prior: 5.06%) appears to have added pressure: a weak auction outcome drives long-end yields higher, increasing the opportunity cost of holding non-yielding gold and reinforcing dollar strength. Price broke below the $4,362 support level — identified across all three of today’s updates as the critical floor — and accelerated to the $4,344 area in the final hour of active trading. The session’s closing structure is a staircase lower with no meaningful demand absorption until the $4,344–$4,350 zone, leaving Friday’s open exposed to further downside if Asia trade does not find a catalyst for stabilization. The full-day range from the $4,452 overnight high to the $4,344 session low represents an intraday drawdown of $108 — a significant single-session move that resets the technical picture materially heading into Friday’s US Retail Sales release.
Daily Recap Levels
- Session high: ~$4,452 (overnight, pre-London)
- Session low: ~$4,344
- Close price: ~$4,350
- Daily bias result: Failed — bull thesis invalidated, bear scenario confirmed in full
- Key support (carried into tomorrow): $4,344 → $4,326 (next structural level below)
- Key resistance (carried into tomorrow): $4,358 → $4,362 → $4,378–$4,386
Overnight / Next Session Watch
Asia trade opens with gold sitting at a technically damaged close — below all short-term moving averages, below the $4,362 support floor, and printing fresh multi-day lows. The primary event for Friday is the US Retail Sales release, which will serve as the final macro verdict on the week’s inflation and consumer data narrative. Bull: Asia session holds $4,344, price recovers above $4,362 before the US open — Friday Retail Sales miss sets up a recovery toward $4,378–$4,386. Bear: $4,344 fails overnight, price drifts toward $4,326 — a weak Retail Sales print does not offset the technical damage and the sell-off extends into the weekend.
Chart Analysis
The 15-minute XAU/USD chart as of 22:31 UTC+3 shows one of the cleanest bearish trending sessions of recent weeks: a series of lower highs and lower lows from the 04:30 peak (~$4,443) through to the 22:17 session low (~$4,344), with only two meaningful counter-trend bounces — one mid-morning around $4,405 and one mid-afternoon around $4,400 — both of which were sold into immediately. The 200-period moving average (blue) has been declining throughout the session and now sits near $4,386, acting as a significant overhead barrier for any recovery attempt. Short-term moving averages (green and orange) are steeply angled lower and widely fanned — no bullish crossover signal is present anywhere in the session structure. The Bollinger Bands remain in full expansion mode to the downside, with price printing below the lower band in the final candles, indicating sustained momentum selling rather than exhaustion. The pink resistance bands at $4,358 and $4,362 are now the immediate overhead levels to watch; below current price, $4,344 is the only marked support before open chart territory toward $4,326. The session closes with no recovery structure in place — Friday’s Asia open will determine whether $4,344 acts as a base or a waypoint lower.
Analysis based on the XAU/USD 15-minute chart as of August 13, 2026, 08:32 UTC+3. This article is for informational and educational purposes only and does not constitute financial advice.