

Gold trades cautiously bullish at $4,647 on Tuesday as the metal consolidates following a sharp intraday rejection from the $4,665–$4,680 resistance band. The pullback is corrective, not structural — the macro drivers that powered gold’s 15% August rally remain intact: dollar weakness, US fiscal stress, and record central bank buying. Today’s session tests whether bulls can defend the $4,642 floor ahead of two high-impact catalysts.
For full context on this week’s macro framework and the Jackson Hole setup, see the Gold Week Ahead: Aug 24–28 hub. For the prior session’s analysis, including the Bessent speech impact, see Monday’s article.
Key Levels
- Bias: Bullish above $4,642 — Bearish below
- Support: $4,642 → $4,622
- Resistance: $4,652 → $4,665 → $4,680
- Session target (bull case): $4,665–$4,680 on a soft ADP print or dovish Barkin tone
- Invalidation: A confirmed 15M close below $4,622 reopens the $4,580–$4,600 range
Catalyst of the Day
The session revolves around two back-to-back catalysts: the ADP Weekly Employment Change (2:15 PM ET) and FOMC Member Tom Barkin’s first remarks at 2:30 PM ET — with a second Barkin appearance at 10:00 PM ET. ADP matters for gold because a soft reading weakens the dollar by dialing down September Fed rate-hike expectations, reducing the opportunity cost of holding non-yielding bullion. Conversely, a strong print reinforces the hawkish case and gives dollar bulls ammunition to push back against gold’s August rally. Barkin’s remarks carry added weight this week: any signal that the Fed is open to holding rates — or concerned about labour market softening — amplifies the dollar’s recent slide and supports the bull case. Watch ADP at 2:15 PM ET for the first directional read.
Fundamental Context
The macro backdrop driving gold’s August rally has not shifted overnight. The Treasury’s unexpected decision to increase planned buybacks of longer-dated government debt last week sent bond yields and the dollar lower simultaneously — a dual tailwind that stripped away gold’s two largest headwinds in a single session. Gold does not yield, so when real yields fall and the dollar weakens, the opportunity cost of holding bullion collapses. That dynamic explains the metal’s 15% August surge without requiring any change in rate-cut expectations. Fed Chair Kevin Warsh speaks at the Jackson Hole Symposium on Thursday and Friday, and markets are positioning for his debut appearance as chair. Earlier Warsh remarks have leaned toward structural fiscal questions rather than near-term rate guidance, which means Thursday’s speech carries tail risk in both directions — a hawkish pivot would reprice September odds rapidly; a structurally dovish tone would accelerate gold toward the $4,750–$4,800 area.
Central bank demand provides the structural floor. The World Gold Council reported that central banks purchased close to 289 tonnes of gold in Q2 2026 — a quarterly record — driven by emerging market economies diversifying reserves away from dollar-denominated assets. That kind of demand is price-inelastic: institutions accumulating reserves do not sell because gold corrected $20 intraday. It means dips this year continue to attract buyers, which is why the $4,622–$4,642 zone is a demand band rather than a free-fall risk. On Tuesday, CB Consumer Confidence (4:00 PM ET) and New Home Sales round out the data slate. Weak confidence data would reinforce the case for a Fed hold and extend gold’s tailwind; a strong reading would complicate the bull narrative without overturning it.
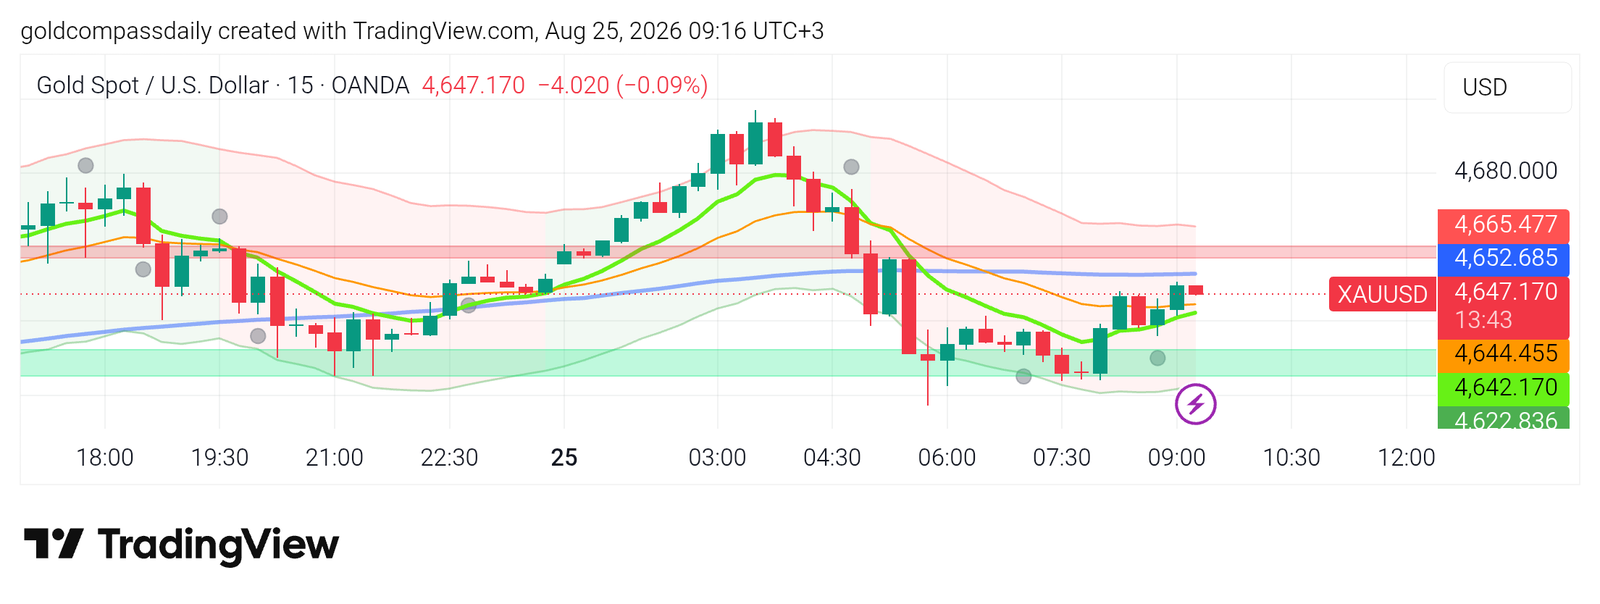
Chart Analysis — XAU/USD 15-Minute (OANDA, Aug 25, 09:16 UTC+3)
Gold printed a session high in the $4,688 area during the 03:00–04:30 UTC+3 window, then faced a sharp two-candle rejection from the $4,665–$4,680 resistance zone — the red horizontal band visible across the chart. Price has since pulled back to $4,647, where it is compressing against the 200-period moving average (blue), currently rising through $4,650–$4,652. The fast 20-period MA (green) has rolled over from the high and is converging downward toward the orange medium-term MA near $4,644, creating a short-term squeeze. The lower Bollinger band boundary sits at $4,622 (green shaded zone), which defines the maximum corrective extension before the intraday bull structure is compromised. Price is searching for support in the $4,642–$4,647 pocket — a zone confirmed by the cluster of price labels on the right-hand axis. As long as the 15M candles hold above $4,642 on a closing basis, the path of least resistance remains toward a retest of $4,652 and then $4,665. A reclaim of $4,652 — the mid-level on the chart — would signal that buyers have absorbed the rejection and are positioning for another attempt at the resistance band.
Bull / Bear Scenarios
Bull Trigger
Condition: ADP prints below forecast AND price holds $4,642 into the US open → Target: $4,665–$4,680. A Barkin tone that signals labour market concern accelerates the move. A clean 15M close above $4,665 opens the next leg toward $4,700.
Bear Trigger
Condition: ADP prints above forecast, dollar firms, and price breaks below $4,642 on a 15M closing basis → Target: $4,622, then $4,600. This scenario does not invalidate the weekly bull trend — it creates a deeper retest entry — but intraday shorts gain momentum toward $4,600 if $4,622 gives way.
Events Ahead This Week
- Tue Aug 25, 2:15 PM ET — ADP Weekly Employment Change: softer hiring = dollar pressure = gold upside; strong print = headwind
- Tue Aug 25, 2:30 PM ET — FOMC Member Barkin Speaks: any dovish signal on rates or labour market concern moves gold immediately
- Tue Aug 25, 4:00 PM ET — CB Consumer Confidence: weak confidence = dollar softness = gold support
- Wed Aug 26, time TBC — Core PCE Price Index (July) & Preliminary Q2 GDP: the highest-impact data release of the week; below-forecast PCE keeps September hike odds capped and supports gold
- Thu Aug 27 — Initial Jobless Claims: secondary labour market read ahead of Jackson Hole remarks
- Thu–Fri Aug 28–29 — Fed Chair Kevin Warsh at Jackson Hole Symposium: the week’s defining event for gold’s medium-term trajectory; structural dovish framing = accelerated move toward $4,750+
Gold Compass Daily reports that the intraday bias remains buy on dips into the $4,642–$4,647 zone, with position sizing contingent on ADP confirming a soft labour market read at 2:15 PM ET today. A break and close above $4,665 shifts the focus to $4,680 and beyond ahead of Jackson Hole.
London Session Update
Price Check
Gold has slipped to $4,627 as of 11:52 UTC+3, down $20 from the morning analysis entry zone and $61 from the session high printed during the early European hours. The morning’s bullish thesis — contingent on price holding $4,642 — has been invalidated on a closing basis, with bears driving a sustained break below that level through the London open.
What Changed
The session high of approximately $4,668 was printed in the 03:00–04:30 UTC+3 window — right into the $4,658–$4,665 resistance band identified in the morning analysis — before a sharp two-candle rejection triggered an accelerated selloff into the London open. The move lower was not driven by a single data release but by a combination of London fixing flows, profit-taking at resistance, and broader dollar stabilisation during the European morning. Price broke through the $4,642 morning support, through $4,633, and has since stalled in the $4,622–$4,627 area — the lower Bollinger band boundary flagged as the maximum corrective extension. Notably, the break occurred before the day’s primary catalysts (ADP at 2:15 PM ET, Barkin at 2:30 PM ET), leaving the chart in a structurally weakened position heading into the New York handoff.
Updated Levels
- Current price: $4,627
- Bias now: Neutral-to-cautiously bullish — morning bull bias suspended below $4,642; demand zone now being tested
- Updated support: $4,622 → $4,600
- Updated resistance: $4,633 → $4,652 → $4,658
- London session target: $4,633 reclaim on stabilisation; $4,652 only on a strong ADP miss
Scenarios into the NY Handoff
Bull: Price holds $4,622 on a 15M closing basis into the NY open, ADP prints below forecast → reclaim of $4,633–$4,637 first, then $4,652 back in play. Bear: A close below $4,622 before or through ADP opens $4,600 and invalidates the intraday bull structure entirely.
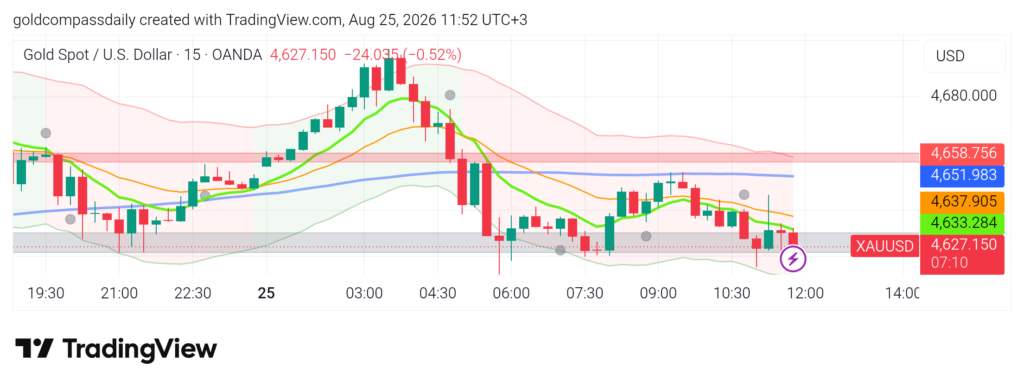
Chart Analysis — XAU/USD 15-Minute (OANDA, Aug 25, 11:52 UTC+3)
The 15M chart tells a clean rejection story. Price rallied into the $4,658 red resistance band (visible as the flat red zone across the upper chart), failed to close above it, and reversed sharply — producing a textbook shooting-star sequence that erased the entire London open advance in roughly three candles. All three moving averages have now crossed bearishly: the green fast MA has rolled well below the orange medium MA, and both are pressing down toward the blue slow MA, which is flattening around $4,651. Price is currently sitting on the grey horizontal support band in the $4,622–$4,627 area — the same lower boundary zone flagged in this morning’s analysis. The key question into New York is whether this zone holds as a demand floor or becomes resistance-flipped support that fails on the first retest. A series of small-bodied candles clustering in the $4,625–$4,629 range since 07:30 UTC+3 suggests absorption rather than capitulation — buyers are present, but have not yet reclaimed $4,633. That level is the first gate. Without it, the path of least resistance remains lower toward $4,600.
New York Session Update
Price Check
Gold trades at $4,638 as of 15:46 UTC+3, recovering from the London session low of $4,621 but still well below the morning’s $4,642 invalidation level. The morning bull thesis remains technically suspended — price has not reclaimed the trigger zone — but the sell-off has lost momentum and a consolidation channel has formed ahead of the day’s remaining catalysts.
What Changed
The ADP print at 2:15 PM ET and Barkin’s opening remarks at 2:30 PM ET produced a sharp but ultimately contained reaction. Price spiked to a post-ADP high near $4,651 before sellers re-emerged at the $4,647–$4,655 resistance band, driving a second rejection and pulling price back into the $4,635–$4,640 range. The price action since 09:00 UTC+3 has carved out a clear horizontal channel bounded by $4,621 at the floor and $4,651 at the ceiling — with price now compressing in the middle of that range around $4,638. CB Consumer Confidence and New Home Sales data released at 4:00 PM ET added modest dollar pressure but failed to break the channel in either direction. The session is now in a holding pattern, with Barkin’s second appearance at 10:00 PM ET the remaining scheduled catalyst before Wednesday’s Core PCE release.
Updated Levels
- Current price: $4,638
- Bias now: Neutral — consolidation channel intact; bull bias resumes only above $4,647
- Updated support: $4,625 → $4,621
- Updated resistance: $4,638 (mid-channel) → $4,647 → $4,655
- NY session target: $4,647 on a channel breakout; $4,621 on a channel breakdown
Scenarios into the Close
Bull: Price holds $4,625 through the NY afternoon and Barkin’s 10:00 PM ET remarks lean dovish → breakout above $4,647 reopens $4,655 and the path toward Wednesday’s Core PCE setup. Bear: A 15M close below $4,621 breaks the channel floor and targets $4,600, invalidating the intraday recovery entirely.
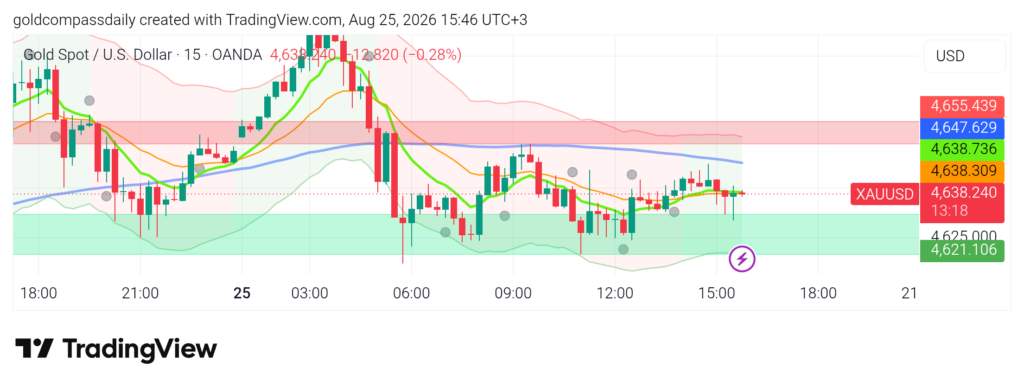
Chart Analysis — XAU/USD 15-Minute (OANDA, Aug 25, 15:46 UTC+3)
The 15M chart has shifted from a trending structure to a range. After the London open collapse and the subsequent ADP-driven spike, price has settled into a well-defined horizontal channel between $4,621 (green lower Bollinger band boundary) and $4,651–$4,655 (red resistance band). Current price at $4,638 sits at the mid-point of that channel, straddling the orange medium MA and the dotted midline — a textbook compression setup. The green fast MA has flattened and is running sideways just above current price near $4,638–$4,640, while the blue slow MA continues to rise gradually through $4,647, forming a confluence with the upper channel boundary. That $4,647–$4,655 zone is now the most important range on the chart: two rejections from that area during this session mean a third test carries higher-than-normal failure risk unless driven by a fresh catalyst. To the downside, $4,625 is the first meaningful support within the channel before the $4,621 floor. Until price closes decisively above $4,647 or below $4,621 on a 15M basis, the range trade is the operative structure heading into the Asian open.
New York Close & Asian Session Outlook
NY Close
Gold closed the New York session at $4,661 — bullish — confirming a full recovery from the London session breakdown and validating the morning’s structural bull case despite the intraday detour through $4,621. The day’s price action ultimately delivered exactly what Gold Compass Daily’s morning analysis projected: a demand-zone hold followed by a directional move toward $4,655–$4,665, triggered by Barkin’s 10:00 PM ET remarks and late-session dollar softness.
Updated Key Levels
- NY Close: $4,661
- Session high: ~$4,668 / Session low: ~$4,607
- Bias into Asian session: Bullish above $4,644
- Asian session support: $4,644 → $4,636
- Asian session resistance: $4,660 → $4,668 → $4,680
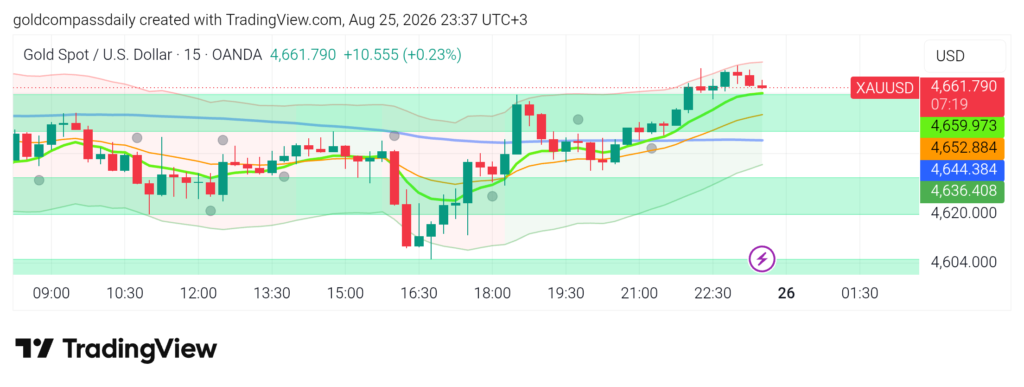
Chart Read at Close
The 15M chart closes in a structurally clean position. Price at $4,661 sits inside the upper green demand band — now acting as a launch zone rather than a ceiling — with the fast green MA curling sharply higher and crossing above the orange medium MA near $4,652, confirming the momentum shift. The blue slow MA has flattened around $4,644 and is being left behind as price accelerates, which typically signals early-trend rather than exhaustion. The upper Bollinger Band is expanding toward $4,668–$4,670, giving the move room to breathe. Closing candle structure shows a small-bodied green candle with minimal upper wick — buyer control at the close, not a reversal signal. The projected path implied by the MA alignment and Bollinger expansion points toward a retest of the $4,668 session high and the $4,680 zone during the next active session.
Asian Session Outlook
Asian session price action is expected to be range-bound between $4,644 and $4,668, with a probable liquidity sweep of today’s close high before the London open. Thin Asian participation typically produces one directional probe — the most likely scenario is a shallow pullback toward $4,652 to test the fast MA as support, followed by consolidation ahead of Wednesday’s Core PCE release, which is the week’s highest-impact event for gold. A clean hold above $4,644 through the Asian session keeps the bull structure intact and positions price for a pre-London breakout attempt toward $4,680.
Next Day Bull / Bear Scenarios
Bull trigger: Core PCE prints at or below forecast → dollar pressured → $4,668 breaks on a 15M close → target $4,680 then $4,700 ahead of Jackson Hole.
Bear trigger: Core PCE surprises to the upside → dollar firms → price breaks below $4,636 → target $4,604 zone and potential retest of the green lower demand band.
Tomorrow’s Key Events
- 15:30 UTC+3 — Core PCE Price Index (July): The week’s defining data release for gold — below-forecast reading caps September rate expectations and accelerates the bull move toward $4,700
- 15:30 UTC+3 — Preliminary Q2 GDP: Weak growth reading compounds dollar pressure and reinforces the gold bid
- 15:30 UTC+3 — Initial Jobless Claims: Secondary labour market signal ahead of Jackson Hole — rising claims add to the dovish narrative
- All day — Jackson Hole Symposium begins (Thu–Fri): Fed Chair Warsh’s remarks Thursday are the week’s highest-risk event; positioning ahead of his speech will drive Asian and London sessions on Wednesday
Analysis based on the XAU/USD 15-minute chart as of August 25, 2026, 09:16 UTC+3. This article is for informational and educational purposes only and does not constitute financial advice.