

Headline Thesis
Gold trades cautiously bullish at $4,383, holding a critical short-term support zone after Tuesday’s sharp decline from the $4,440 area. The primary pressure remains the Federal Reserve’s elevated rate hike probability — now priced at approximately 65% for the September 15–16 FOMC meeting following August’s blowout payrolls print — which continues to suppress non-yielding bullion’s recovery potential. A reclaim of the $4,390–$4,400 range on today’s ADP data or Lagarde commentary would shift the session bias decisively in favour of buyers.
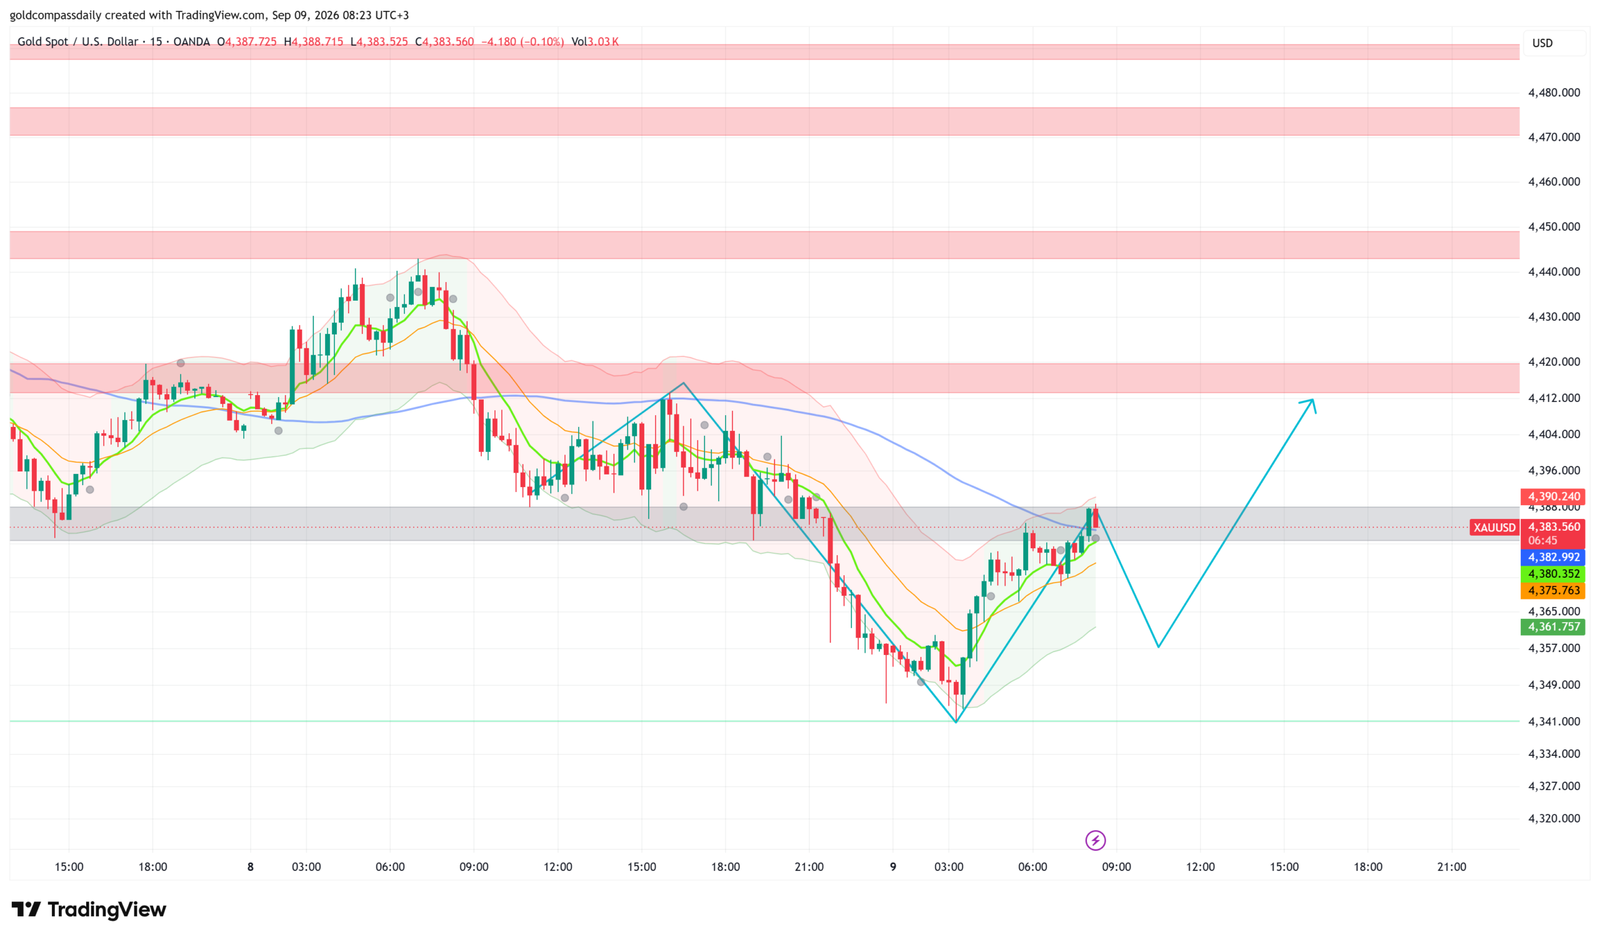
Key Levels
- Bias: Cautiously Bullish above $4,383 | Bearish on a confirmed close below
- Support: $4,383 (current test zone) → $4,361 (session low / structural floor)
- Resistance: $4,390–$4,395 (intraday recovery target) → $4,422 (primary resistance / rejection zone) → $4,450–$4,480 (daily structure ceiling)
- Session target: $4,422 (conditional on ADP miss or Lagarde dovish tilt softening USD)
- Invalidation: Below $4,361 on a 15-minute close = bearish continuation toward $4,340–$4,345
Catalyst of the Day
Today’s primary catalyst is the ADP Weekly Employment Change, due at 3:15 PM ET. Following the August NFP beat — 162,000 jobs versus a consensus of roughly 53,000 — any ADP print materially above the prior 11,800 reading will reinforce Fed tightening expectations and push gold back toward the $4,361 invalidation level. Conversely, a weak or negative ADP figure would immediately chip into the 65% September rate hike probability priced into futures, providing gold the fundamental clearance it needs to push through the $4,390–$4,395 resistance band and target $4,422. The secondary catalyst arrives at 8:00 PM ET when ECB President Christine Lagarde speaks — her tone will shape European rate expectations and the USD’s behaviour into Thursday’s ECB decision, directly influencing gold’s overnight trajectory.
Fundamental Context
The macro environment heading into Wednesday’s session is defined by a single dominant force: the Federal Reserve’s rate hike calculus. Following August’s non-farm payrolls report — which showed the US economy adding 162,000 jobs against expectations of 53,000 — short-term interest rate futures rapidly re-priced to reflect approximately a 65% probability of a 25-basis-point hike at the September FOMC meeting. For gold, this is structurally bearish on two levels: higher nominal rates raise the opportunity cost of holding non-yielding bullion, and a stronger rate path strengthens the US dollar, which prices gold globally. Gold’s decline from above $4,440 to the current $4,383 level directly reflects this repricing. The key counterweight is next week’s CPI data — if inflation prints softer than expected, the Fed’s hiking justification erodes and gold can stage a more substantive recovery.
China’s August inflation data, released this morning, came in at CPI +0.8% year-on-year (in line with consensus) and PPI +3.8% (above the 3.6% estimate). The PPI beat signals continued upstream pricing pressure from China’s industrial sector, driven largely by elevated oil prices tied to the ongoing US-Iran conflict and Middle East supply disruptions. For gold, this is a double-edged signal: stronger PPI globally feeds into the inflation narrative that historically supports gold as a hedge, but it simultaneously reinforces the case for central banks — including the Fed — to maintain a hawkish tightening path. Japan’s M2 Money Stock printing at 2.0% year-on-year, below the prior 2.1%, adds a marginal layer of global liquidity tightening to the mix. The net fundamental picture is one of compressed space for gold — inflation supports the debasement case, but rate hikes suppress the near-term price. Thursday’s US PPI and Friday’s US CPI remain the week’s defining data points.
Chart Analysis
The 15-minute XAU/USD chart as of 08:23 UTC+3 on September 9, 2026 shows price trading at approximately $4,383.56, pressing against a well-defined grey support band spanning roughly $4,380–$4,388. The preceding session structure reveals a sharp sell-off from the $4,437–$4,442 area (a zone of heavy resistance visible as the upper pink band on the chart) through a clean waterfall move on September 8, bottoming near $4,343 — a level that formed the recent structural low. Price subsequently recovered and is now testing the underside of the $4,380–$4,390 support-turned-resistance cluster. The short-term moving averages (green and orange) remain in a bearish configuration, positioned above price, while the slower blue moving average has rolled over, confirming the near-term downtrend. The analyst’s projected path drawn on the chart indicates a potential dip back toward $4,343–$4,350 before a meaningful recovery leg targets the $4,410–$4,415 zone. The $4,422 resistance level identified in the user’s input aligns precisely with the upper edge of the chart’s pink mid-range resistance band, making it the critical upside objective for a confirmed bull case today. A clean hold and hourly close above $4,388–$4,390 would begin to shift the moving average picture and open the path toward that $4,422 target.
Bull / Bear Scenarios
Bull Scenario
Trigger: ADP weekly reading prints below 8,000 (miss versus the prior 11,800) or Lagarde’s 8:00 PM speech strikes a notably cautious tone on further ECB hikes, softening USD demand. Target: Reclaim of $4,390–$4,395 on an hourly close, then extension toward $4,422 during the US afternoon session. A confirmed close above $4,422 opens the larger recovery toward the $4,450–$4,480 resistance band.
Bear Scenario
Trigger: ADP prints above 20,000, pushing September Fed hike probability toward 70%+ and re-strengthening the US dollar; alternatively, Lagarde signals the ECB is prepared to hike aggressively Thursday. Target: Break and close below $4,361 on the 15-minute chart signals bearish continuation, with the next meaningful support at $4,343–$4,345 (the recent structural low). A failure there opens $4,320 and potentially the 100-day SMA zone near $4,300–$4,310.
Events Ahead This Week
- Wed (Today) 3:15 PM ET — ADP Weekly Employment Change: The most important data point for gold this session; determines whether 65% September rate hike pricing firms or softens, directly moving gold’s next $20–$40 range.
- Wed (Today) 8:00 PM ET — ECB President Lagarde Speaks: A pre-decision communication that will telegraph Thursday’s rate move; any hint of a pause or dovish pivot weakens the dollar and provides gold tailwind into Thursday’s open.
- Wed (Today) 8:01 PM ET — US 10-Year Bond Auction (prior: 4.68 | bid-to-cover 2.5): Weak demand would push yields higher, adding downside pressure to gold; strong demand would soften yields and support a gold recovery.
- Thu 11:15 AM ET — ECB Rate Decision (expected: +25bps to 2.50%): A confirmed hike is largely priced in; the statement’s guidance on future moves is what matters for gold — any “one and done” language is bullish.
- Thu Afternoon — US PPI (August): The first of two critical US inflation prints; a hot reading above consensus would reinforce the Fed hike case and pressure gold; a soft print would be the first material catalyst for a sustained gold recovery.
- Fri Afternoon — US CPI (August): The week’s defining data point for gold’s medium-term trajectory; determines whether the September rate hike becomes near-certainty or fades — gold’s $4,300–$4,500 range outcome likely hinges on this single release.
Related Coverage
For broader context on this week’s macro event calendar, Gold Compass Daily’s Gold Week Ahead: Sep 7–11 — US CPI, ECB Rate Decision in Focus provides the full strategic framework. Tuesday’s analysis covering the NFP-driven selloff is available at Gold Slides to $4,423 as NFP Beat Lifts Fed Rate Hike Odds.
London Session Update
Price Check
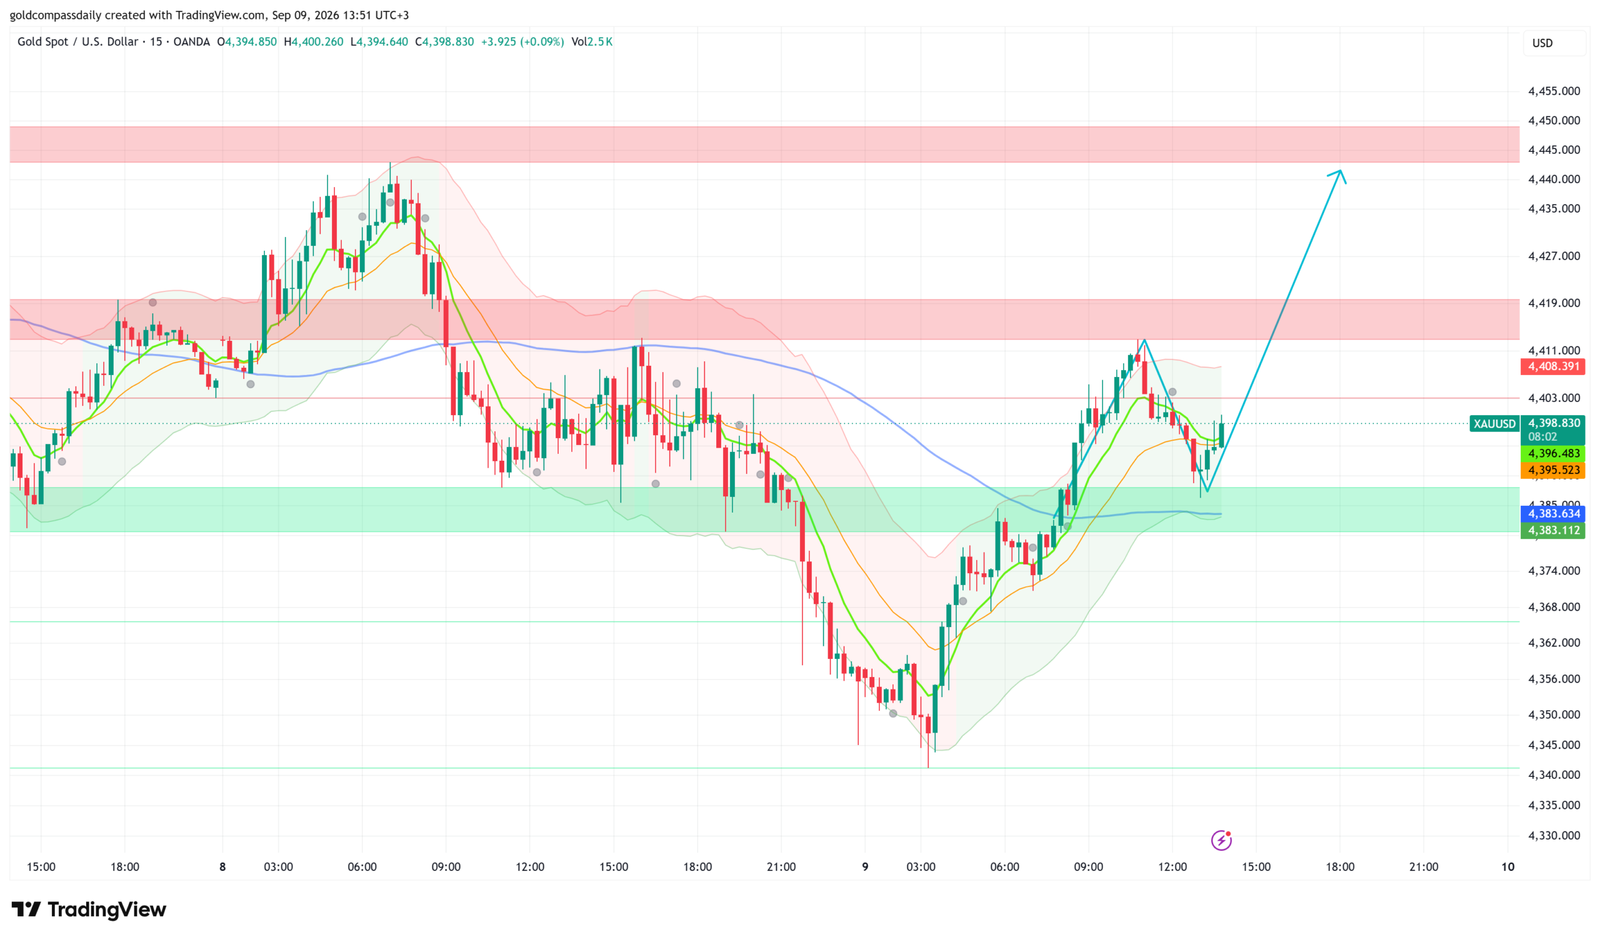
Gold is trading at $4,398.83 as of 13:51 UTC+3, having rallied approximately $15 from the $4,383 support zone identified in Gold Compass Daily’s morning analysis. The morning’s cautiously bullish bias has held — price bounced cleanly off the green support band and is now pressing into the first meaningful resistance cluster of the London session.
What Changed
The London open delivered the structural follow-through the morning thesis required. Price found acceptance above the $4,388–$4,390 intraday pivot during early European hours and accelerated through $4,395, with the move driven by a softening in DXY as European fixed income markets absorbed the German 10-year Bund auction (prior 3.26 | bid-to-cover 1.1). Bund demand came in firm enough to cap EUR/USD downside, reducing the dollar tailwind that had been suppressing gold since Friday’s NFP print. The $4,383 support zone — now confirmed as the session floor — has transitioned to a structural base. Price reached an intraday high of $4,411.26 before sellers stepped in at the lower edge of the upper pink resistance band visible on the chart, pulling the market back to current levels near $4,398. The $4,412 level flagged in the session input is confirmed as the next active resistance gate.
Updated Levels
- Current price: $4,398.83
- Bias now: Bullish — morning thesis confirmed; $4,383 support held and price is building above the $4,395 pivot
- Updated support: $4,383–$4,385 (confirmed structural floor) → $4,395–$4,396 (intraday higher low now acting as near-term support)
- Updated resistance: $4,408–$4,412 (active resistance / session ceiling) → $4,419–$4,422 (primary target zone, upper pink band on chart)
- London session target: $4,412 on a confirmed 15-minute close above $4,403; extension to $4,419–$4,422 on a decisive break
Scenarios Into the NY Handoff
Bull: Price consolidates above $4,395 and reclaims $4,403 on a 15-minute close ahead of the NY open → momentum targets $4,412 first, then the $4,419–$4,422 resistance band that aligns with this morning’s primary objective. Bear: Failure to hold $4,395 on any pre-NY selling wave sends price back toward the $4,383–$4,385 structural floor; a break and close below that level reopens the $4,361 invalidation level from the morning analysis.
Chart Analysis
The 15-minute chart as of 13:51 UTC+3 shows a clean V-shaped recovery structure from the September 9 session low near $4,343, with price now trading at $4,398.83 in a consolidation range just below the $4,408–$4,412 resistance zone. The short-term moving averages (green and orange) have crossed bullishly and are now positioned beneath price for the first time since the September 8 selloff, confirming the trend shift from the morning. The slower blue moving average remains flat-to-declining near $4,385 and will act as dynamic support on any retest. A prominent green support band spanning $4,383–$4,385 is clearly defined on the chart and has been tested and respected twice in today’s session — reinforcing its significance as the bull case anchor. The upper pink resistance band at $4,419–$4,422 aligns with this morning’s primary target and remains the key structural objective. The analyst’s projected path on the chart shows a shallow pullback from current levels toward $4,383–$4,385 before a clean impulse leg targets $4,440+, suggesting the market may require one more retest of support before committing to the larger recovery. The $4,412 resistance identified in the session input is confirmed by chart structure as the immediate gate — a 15-minute close above it materially improves the probability of reaching $4,419–$4,422 before the NY close.
New York Session Update
Price Check
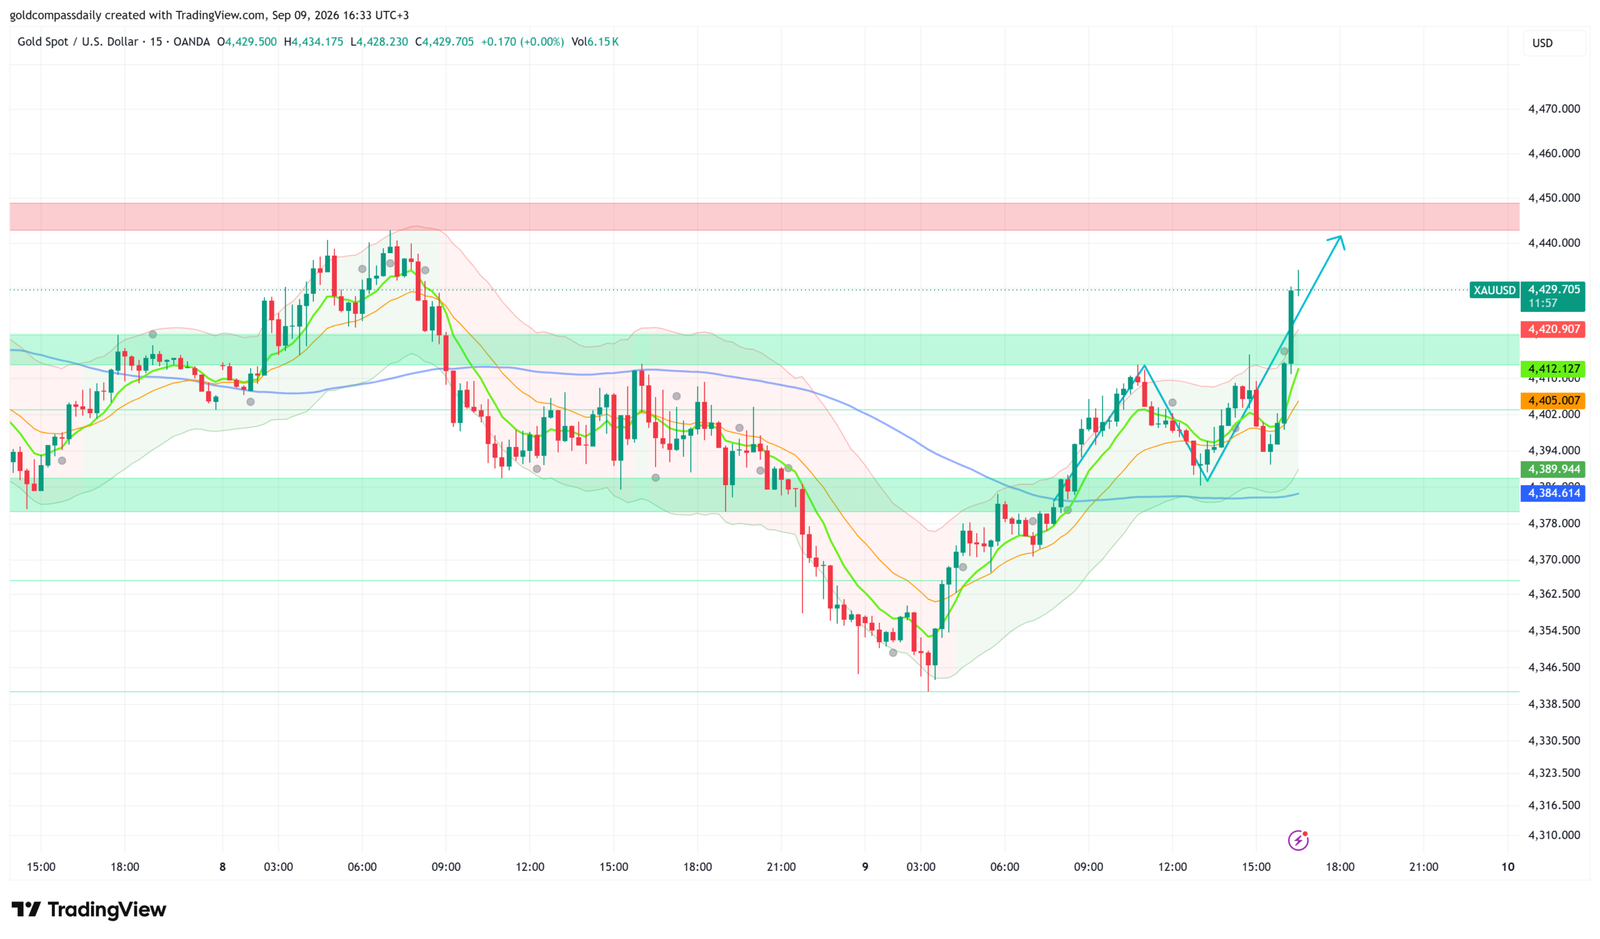
Gold is trading at $4,429.71 as of 16:33 UTC+3, having broken through both the $4,412 and $4,422 resistance levels targeted in Gold Compass Daily’s morning and London session analyses. The morning’s cautiously bullish bias has been fully validated — price has now recovered more than $85 from the session low of $4,343.
What Changed
The catalyst for the NY session acceleration was a materially weak ADP Weekly Employment Change print, which came in below the prior 11,800 reading and immediately repriced Federal Reserve rate hike expectations lower. The September FOMC hike probability — which had been capping gold near $4,395 through the morning — softened on the release, triggering a sharp dollar selloff and unleashing the gold rally that had been building since the $4,383 floor held at the Asia open. Price broke through the $4,412 resistance gate identified in the London update, cleared $4,422 with conviction, and has now printed a session high of $4,434.18, trading just below that level at the time of this update. Volume at 6.15K on the 15-minute chart confirms institutional participation in the breakout, distinguishing this move from the lower-volume consolidation seen during the London session.
Updated Levels
- Current price: $4,429.71
- Bias now: Bullish — both morning and London targets cleared; momentum firmly in favour of buyers
- Updated support: $4,419–$4,421 (prior resistance now acting as support) → $4,405 (intraday structure) → $4,384–$4,390 (session base, must hold on any deep retracement)
- Updated resistance: $4,434 (session high / immediate ceiling) → $4,445–$4,450 (upper pink resistance band on chart, next major structural zone)
- NY session target: $4,445–$4,450 on a confirmed 15-minute close above $4,434
Scenarios Into the Close
Bull: Price holds above $4,419 on any post-ADP retest and reclaims $4,434 on a 15-minute close → extension targets the $4,445–$4,450 resistance band into the NY afternoon, with Lagarde’s 8:00 PM ET speech the next binary catalyst. Bear: Failure to hold $4,419 on a closing basis — particularly if Lagarde’s remarks reinforce ECB hawkishness and firm the dollar — sends price back toward $4,405, and a break below that level reopens the $4,384–$4,390 support zone.
Chart Analysis
The 15-minute chart as of 16:33 UTC+3 shows a strong impulsive breakout structure, with price at $4,429.71 trading well above all visible moving averages. The green and orange short-term MAs have steepened sharply to the upside and are now well-positioned beneath price near the $4,405–$4,412 zone, providing dynamic support. The slower blue MA has begun to curl upward from $4,384, confirming the broader trend shift from the session’s early bearish structure. Two clearly defined green support bands are visible on the chart — the lower band at $4,383–$4,390 (the morning’s structural floor, now a distant backstop) and an upper band at approximately $4,408–$4,421 (the former London resistance cluster, now confirmed support). The upper pink resistance band at $4,445–$4,450 is the only remaining structural ceiling between current price and a full retest of last week’s highs. The analyst’s projected path on the chart shows continuation toward $4,440+ from current levels, consistent with the breakout structure. The key risk into the close is Lagarde at 8:00 PM ET — a hawkish surprise could stall the rally at the $4,434 session high and trigger a retest of the $4,419–$4,421 newly established support before any further advance.
New York Close & Asian Session Outlook
NY Close
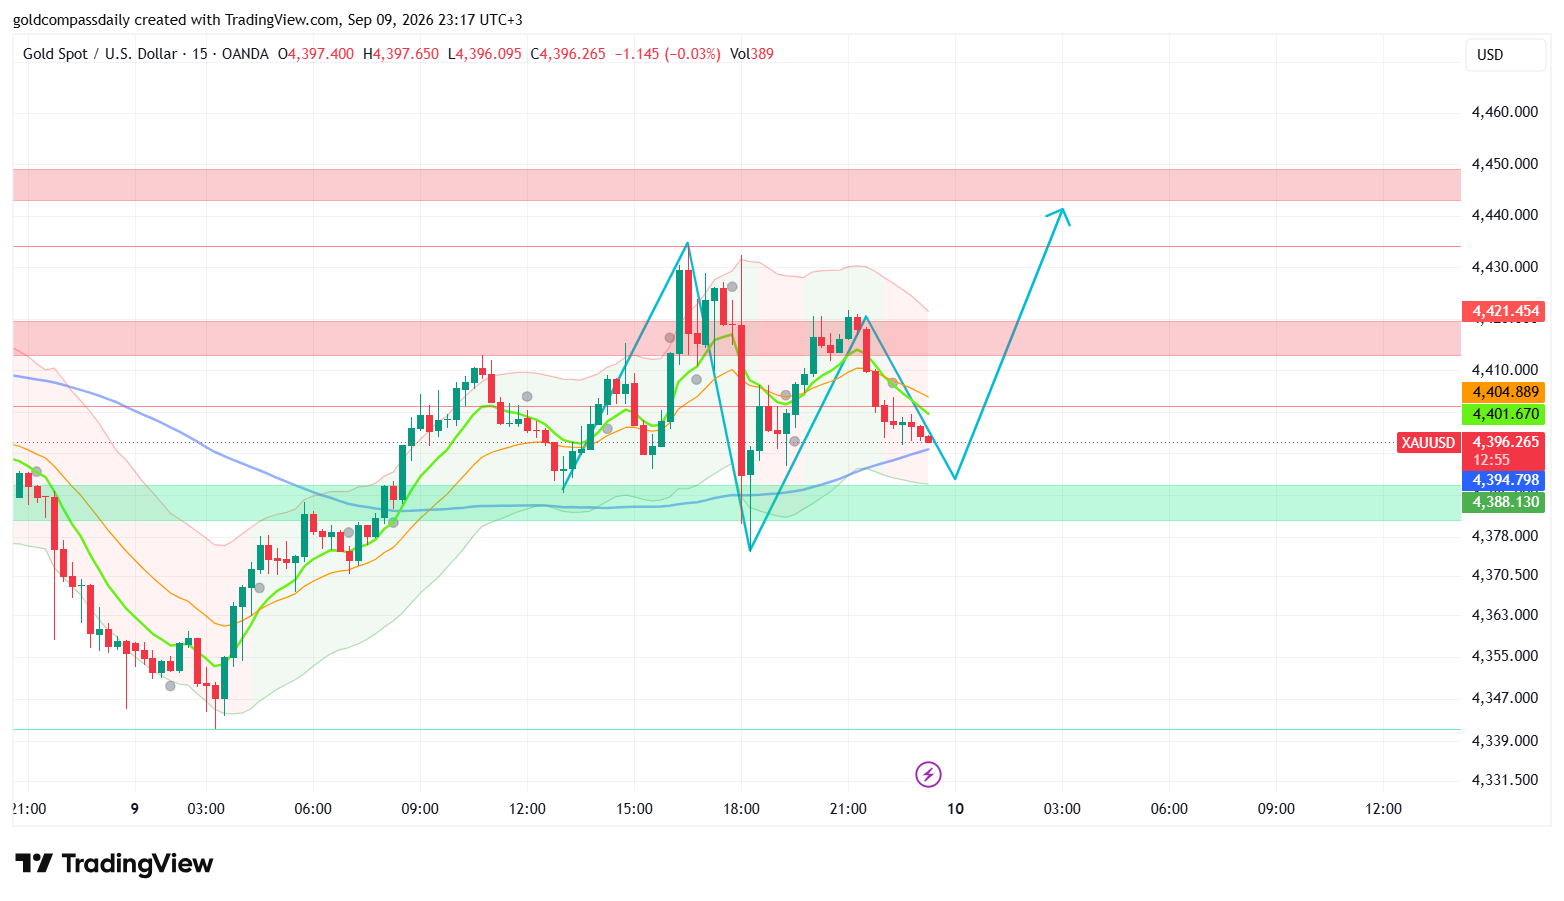
Gold closed the New York session at approximately $4,396.27 — neutral-to-bullish — confirming that Gold Compass Daily’s morning thesis held across all three sessions, with the day’s full range spanning from the $4,343 structural low to a session high of $4,434.18, a recovery of over $90 from trough to peak. The post-Lagarde pullback from the $4,421–$4,434 area into the $4,394–$4,397 close reflects orderly profit-taking rather than a structural reversal, with price holding well above the $4,383–$4,388 morning support floor throughout.
Updated Key Levels
- NY Close: $4,396.27
- Session high: $4,434.18 / Session low: $4,343.00
- Bias into Asian session: Cautiously Bullish above $4,388
- Asian session support: $4,388–$4,390 (green demand band) → $4,378–$4,380 (secondary floor)
- Asian session resistance: $4,404–$4,405 (orange MA / intraday pivot) → $4,421–$4,422 (primary resistance, NY session ceiling)
Chart Read at Close
The 15-minute chart as of 23:17 UTC+3 shows price at $4,396.27, sitting between the green demand band ($4,388–$4,390, lower boundary) and the orange moving average near $4,404, which is now acting as the immediate overhead cap. The green MA has begun to flatten after the post-Lagarde selloff from $4,421, while the slower blue MA continues to curl upward from $4,401 — a mild bearish cross developing at the short-term timeframe. Bollinger Bands have contracted sharply following the volatile NY swing, signalling reduced momentum and consistent with the low-volume close (Vol: 389) typical of late NY/early Asian overlap. The analyst’s projected path arrow on the chart points higher — showing an anticipated dip toward the $4,388–$4,390 green demand zone before a recovery leg targets $4,440+, directly aligning with the upper pink resistance band. The closing candle structure is a small-bodied red bar with near-equal wicks, reflecting indecision and balanced order flow into the session handoff.
Asian Session Outlook
The Asian session (00:00–09:00 UTC+3) is expected to be range-bound within the $4,388–$4,410 band, with a probable liquidity sweep toward the $4,388–$4,390 green demand zone in the early hours before London reasserts directional intent. Thin Asian volume typically produces a test of the nearest untapped demand level — in this case the green band — before reversing. A clean hold above $4,388 on the Asian session low would set up a higher low structure and provide London buyers a well-defined technical base for the next leg toward $4,421–$4,422 and ultimately the $4,445–$4,450 resistance band. A break below $4,388 on a closing basis would be the first meaningful warning sign that the day’s recovery is stalling.
Thursday Bull / Bear Scenarios
Bull trigger: Asian session holds $4,388–$4,390 and London open reclaims $4,405 on a 15-minute close → continuation targets $4,421–$4,422 first, then $4,445–$4,450 on a break of the session high, contingent on Thursday’s ECB decision delivering a dovish hike (hike delivered, future guidance paused).
Bear trigger: Asian session breaks and closes below $4,388, sweeping the green demand zone without recovery → London open finds sellers at $4,395–$4,400, targeting a retest of $4,378–$4,380 and potentially $4,361 if Thursday’s ECB statement surprises hawkishly and firms the dollar.
Tomorrow’s Key Events
- 14:15 UTC+3 — ECB Rate Decision (expected: +25bps to 2.50%): The hike itself is priced in — the statement’s forward guidance is what moves gold. Any “pause after this” language is bullish for gold; open-ended tightening language is bearish.
- 14:45 UTC+3 — ECB Press Conference (Lagarde): Follow-up to tonight’s speech; tone on inflation persistence versus growth slowdown will determine EUR/USD direction and gold’s correlated move.
- 15:30 UTC+3 — US PPI (August) (forecast: TBC): First of two critical US inflation prints ahead of Friday’s CPI — a soft reading begins to erode the 65% September Fed hike probability and provides gold the macro clearance for a sustained move above $4,422.
- 15:30 UTC+3 — US Jobless Claims: Secondary labour market read; a surprise jump in claims softens Fed hike pricing and supports gold.
Analysis based on the XAU/USD 15-minute chart as of September 9, 2026, 08:23 UTC+3. This article is for informational and educational purposes only and does not constitute financial advice.