

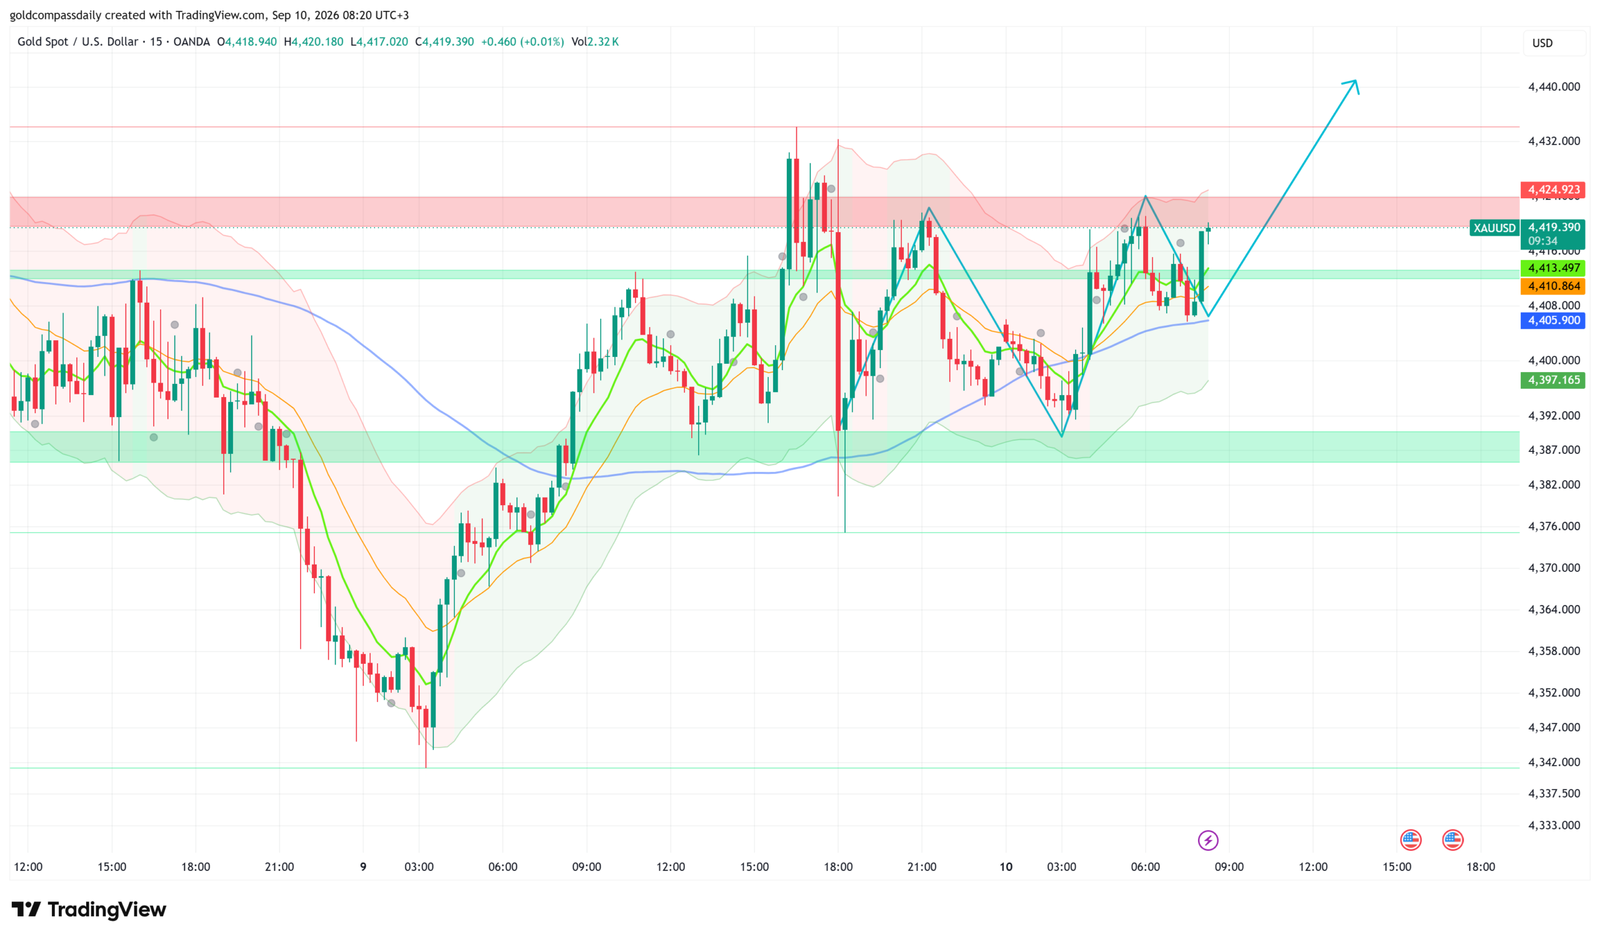
Gold trades cautiously bullish at $4,419, pressing against a well-defined resistance band between $4,420 and $4,425 as markets brace for two high-impact catalysts: the European Central Bank’s rate decision and US Producer Price Index data. A confirmed break above $4,425 opens the path toward $4,440, while a rejection at current levels risks a pullback into the $4,410–$4,413 support cluster.
Key Levels
- Bias: Bullish above $4,413 | Bearish below $4,405
- Support: $4,413 → $4,410 → $4,405
- Resistance: $4,420 → $4,425 → $4,440
- Session target: $4,440 (conditional on ECB dovish guidance + PPI miss)
- Invalidation: Below $4,397 — structural breakdown, bullish thesis abandoned
Catalyst of the Day: ECB Rate Decision and US PPI
The European Central Bank’s rate announcement at 3:15 pm UTC+3 is the dominant market event for Thursday’s session. The ECB is expected to cut its Main Refinancing Rate from 2.40% to 2.65% — a further step in its easing cycle that carries direct implications for gold. ECB rate cuts compress real European yields, weaken the euro, and historically redirect institutional demand toward hard assets including gold. The ECB Press Conference at 3:45 pm UTC+3 carries equal or greater weight: forward guidance from President Lagarde on the pace of future cuts will determine whether this easing cycle remains measured or accelerates. At 3:30 pm UTC+3, US Core PPI (forecast 0.3%, prior 0.2%) and headline PPI (forecast 0.4%, prior 0.0%) land simultaneously. A PPI beat would complicate the Federal Reserve’s rate path, lift real yields, and apply downward pressure on gold — the direct counterforce to any ECB-driven rally. Watch the 3:15–3:45 pm UTC+3 window for the directional trigger.
Fundamental Context
Gold’s macro backdrop remains structurally supportive entering Thursday’s session. The Fed’s interest rate trajectory has become less certain following a string of mixed US data, with markets recalibrating expectations around the pace of any future policy adjustments. When rate cut timelines extend, real yields rise and gold faces headwinds — but equally, when central banks in Europe accelerate their easing cycles, the divergence dynamic weakens the dollar broadly and supports gold through the currency channel. The ECB moving ahead of the Fed is a net positive for XAU/USD.
On the inflation front, today’s US PPI reading is the final major inflation input before next week’s CPI. The prior PPI headline reading printed flat at 0.0% — a significant undershoot that contributed to gold’s recent push toward $4,420. A second consecutive soft PPI print would reinforce the disinflation narrative, reduce pressure on the Fed to hold rates higher for longer, and provide gold with the fundamental clearance to break the $4,420–$4,425 resistance ceiling. Conversely, a hot PPI print at or above forecast would reintroduce Fed hawkishness into the equation and likely trigger a test of the $4,410–$4,405 support zone. The US Unemployment Claims print (forecast 205K, prior 206K) is a secondary input — a stable labor market reduces immediate Fed cutting urgency, but is unlikely to move gold materially unless it deviates sharply from consensus.
Chart Analysis
The 15-minute XAU/USD chart as of 08:20 UTC+3 on September 10 shows price at $4,419, pressing into the upper boundary of a clear resistance band marked between approximately $4,420 and $4,425, highlighted in red on the chart. The recent price structure depicts a V-shaped recovery from a sharp selloff to the $4,344 area earlier this week, with price reclaiming all key moving averages — the short-term green MA, intermediate orange MA, and the slower blue MA — which are now sequentially aligned in bullish order beneath price. The projected path drawn on the chart points toward $4,440, contingent on a sustained hold above $4,413. Immediate support is layered at $4,413 (green zone upper boundary), $4,410, and $4,405 (blue MA level), with the broader support band visible between $4,387 and $4,392 representing the last significant structural defense. The chart confirms the $4,420–$4,425 resistance zone noted in the input: price is testing this ceiling and the next candles — particularly around the 3:15 pm ECB event — will determine whether the breakout scenario activates or a consolidation/rejection pattern develops.
Bull and Bear Scenarios
Bull Scenario
Trigger: ECB delivers dovish guidance + US Core PPI prints at or below 0.2% → price breaks and closes a 15-minute candle above $4,425. Target: $4,440, with extension toward $4,450 on momentum continuation. Position management: trail stop to $4,413 on a confirmed close above $4,425.
Bear Scenario
Trigger: US PPI prints above forecast (Core PPI ≥ 0.4%) and/or ECB guidance signals a pause in cuts → price rejects $4,420–$4,425 and closes a 15-minute candle below $4,410. Target: $4,397, with secondary target at the $4,387–$4,392 support band if $4,397 fails to hold. Invalidation of the daily bullish thesis: close below $4,397.
Events Ahead
- Thu 09:00 UTC+3 — German Final CPI m/m (forecast 0.2%): Confirms or revises eurozone inflation expectations; a soft print reinforces ECB cut rationale, gold-positive.
- Thu 15:15 UTC+3 — ECB Main Refinancing Rate (forecast 2.65% from 2.40%): Rate cut expected; the press conference guidance at 15:45 is the higher-impact event for gold.
- Thu 15:30 UTC+3 — US Core PPI m/m (0.3%) + PPI m/m (0.4%) + Unemployment Claims (205K): Triple data release; PPI outcome is the dominant gold mover of the three.
- Thu 15:45 UTC+3 — ECB Press Conference: Lagarde’s tone on the pace of future cuts will drive EUR/USD and gold through the rest of the session.
- Thu 19:00 UTC+3 — Crude Oil Inventories (forecast -1.4M): Risk-sentiment indicator; a large draw supports risk-on positioning, indirectly gold-neutral to slightly positive.
- Thu 20:01 UTC+3 — US 30-Year Bond Auction (prior 5.22%): Weak demand = rising long yields = short-term headwind for gold. Watch the bid-to-cover ratio.
- Fri Sep 11 — US CPI m/m and y/y: The week’s highest-impact data point for gold; sets the narrative for Fed September meeting expectations. See the weekly hub for full preview.
For Wednesday’s session context and the prior support structure at $4,383, see yesterday’s analysis.
London Session Update
Price Check
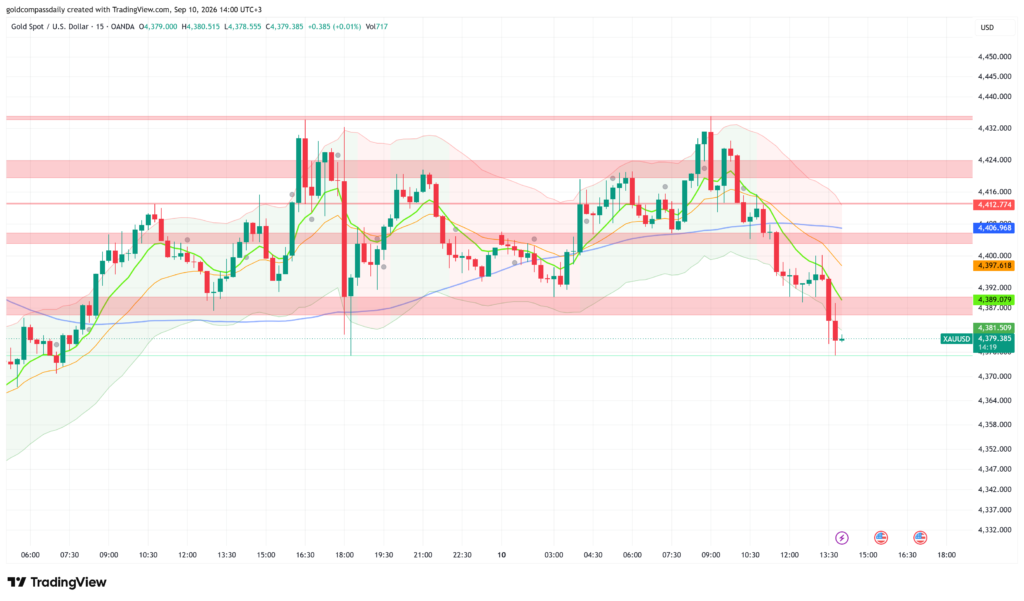
Gold has reversed sharply from the $4,419 resistance zone identified in Gold Compass Daily’s morning analysis, trading at $4,379 as of 14:00 UTC+3 — a $40 intraday decline that has invalidated the morning’s bullish thesis and breached the $4,397 structural invalidation level cited at the open.
What Changed
The selloff accelerated through the London session as price failed to hold the $4,420–$4,425 resistance ceiling for a second consecutive attempt, triggering a cascade of stops through $4,413, $4,407, and $4,397 in rapid succession. The sharpest leg lower occurred between 13:00 and 14:00 UTC+3, coinciding with the pre-ECB positioning window as European traders reduced long exposure ahead of the 15:15 UTC+3 rate decision. The breakdown carries structural weight: price has now sliced through multiple support bands that previously contained selling pressure, and the moving averages — which were aligned bullishly beneath price at the morning open — have rolled over, with the short-term green MA crossing below the orange MA, a bearish signal on the 15-minute timeframe.
Updated Levels
- Current price: $4,379
- Bias now: Bearish — morning bull thesis invalidated below $4,397; bias shifts to sell-the-rally until structure recovers
- Updated support: $4,375 → $4,368 (chart structure low visible below current price)
- Updated resistance: $4,389 → $4,397 → $4,407
- London session target: $4,368 (if $4,375 fails to hold into NY open)
Scenarios into the NY Handoff
Bull: ECB delivers hawkish surprise or US PPI misses significantly → price reclaims $4,389 and holds on a 15-minute close → target $4,397 recovery with $4,407 as the level that would re-engage the original bullish structure.
Bear: PPI prints at or above forecast + ECB guidance is neutral → price fails $4,375 on a 15-minute close → target $4,368, with the $4,387–$4,392 zone now acting as overhead resistance rather than support.
Chart Analysis
The 15-minute chart as of 14:00 UTC+3 shows a clear trend reversal from the morning session highs near $4,432. Price spiked to that level during the early London window before sellers asserted control across a sustained five-hour decline. The labeled support bands on the chart — $4,412, $4,406, $4,397, and $4,389 — have each been breached in sequence, confirming a structured distribution rather than a single-event spike down. Current price at $4,379 sits between the $4,381 level marked on the chart and a thin area of chart structure extending toward $4,375. All three moving averages (green, orange, blue) are now positioned above price and curling downward, providing layered dynamic resistance on any recovery attempt. The Bollinger Bands have expanded sharply to the downside, consistent with an impulsive breakdown rather than a ranging correction. The projected path favors continued pressure toward $4,368–$4,375 unless the ECB or PPI catalysts deliver a material dovish/soft shock in the next 90 minutes.
New York Session Update
Price Check
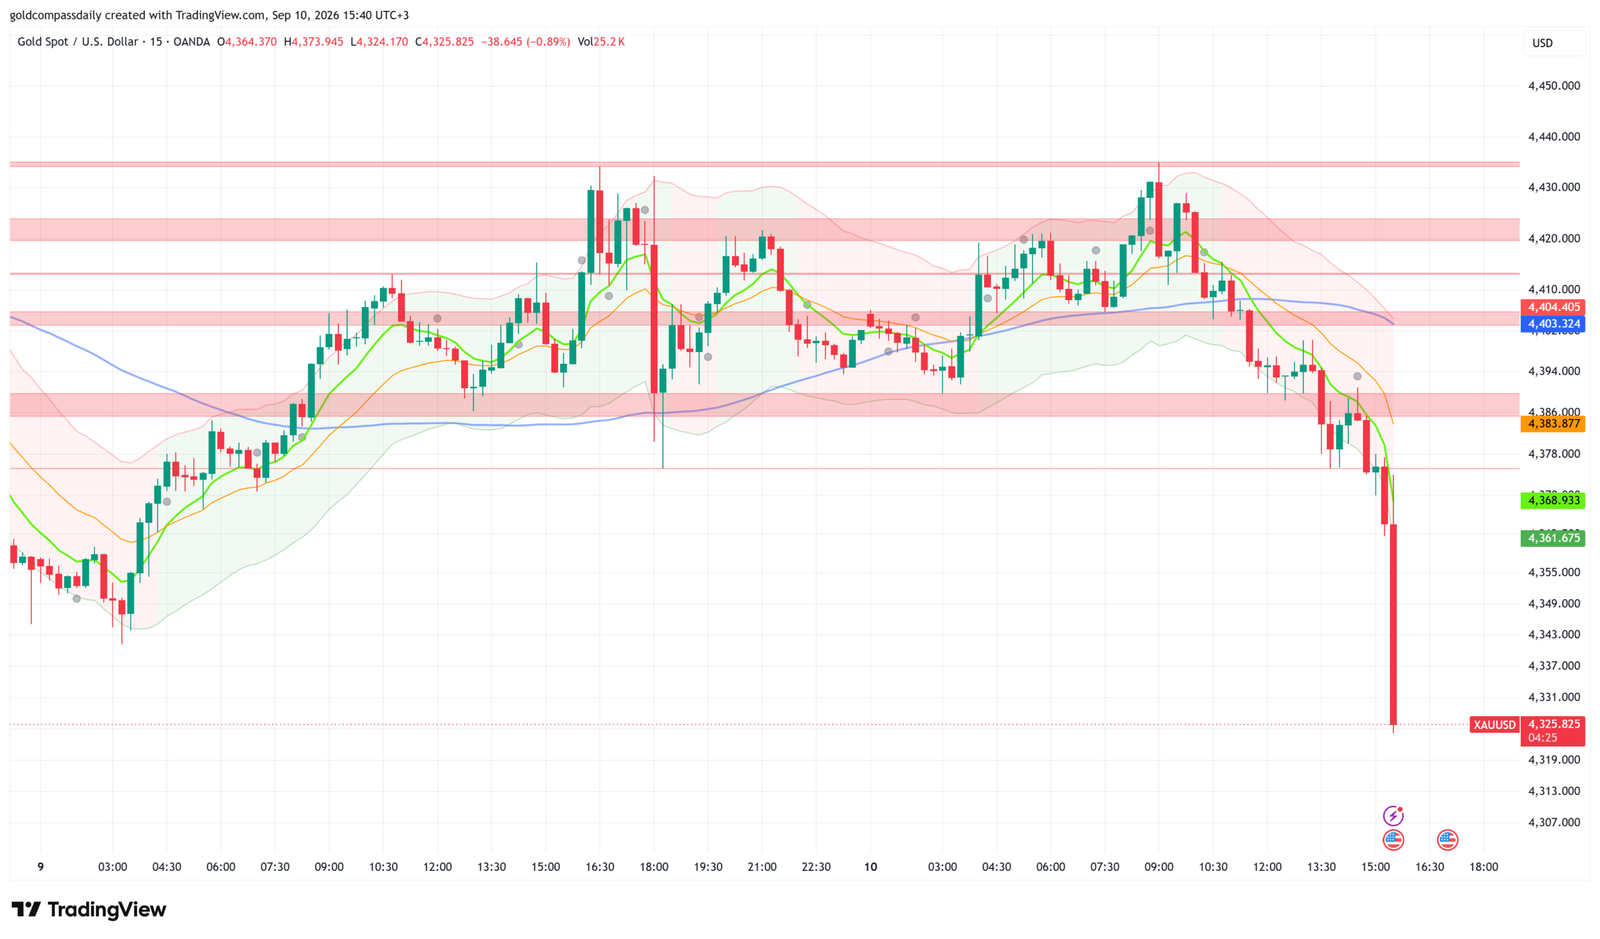
Gold has collapsed to $4,325 at the NY open — a $94 intraday decline from the morning’s $4,419 level — obliterating every support level identified in Gold Compass Daily’s morning analysis and triggering a structural breakdown that extends well beyond the $4,397 invalidation threshold flagged at the open.
What Changed
The decisive catalyst was the simultaneous release of US PPI and Unemployment Claims at 15:30 UTC+3. Headline PPI printed at 0.4% against a 0.0% prior, while Core PPI came in at 0.3% — both at or above forecast, reinforcing Fed hawkishness and driving a sharp repricing of rate cut expectations. The data landed into a market that was already technically fragile following the London session rejection at $4,432, and the combination of hot producer prices and an ECB rate cut — which the ECB delivered as expected at 15:15 UTC+3 — created a divergence dynamic that aggressively bid the US dollar. A stronger dollar and recalibrated Fed pause narrative removed the two primary tailwinds that underpinned the morning’s bullish thesis. The resulting selloff was vertical: price broke $4,383, $4,368, and $4,361 in a single 15-minute candle, with the chart showing a near-$60 wick to $4,325 on the data print — a level with no prior chart structure to arrest the move.
Updated Levels
- Current price: $4,325
- Bias now: Strongly bearish — full structural breakdown; morning bull thesis fully invalidated
- Updated support: $4,325 (current spike low) → $4,307 (chart extension below)
- Updated resistance: $4,361 → $4,368 → $4,383
- NY session target: $4,307 on a confirmed close below $4,325 | $4,361 recovery target if spike reverses
Scenarios into the Close
Bull: Price holds $4,325 and produces a 15-minute close back above $4,361 on fading PPI reaction → short-covering rally targets $4,383, with $4,386 as the level that would signal stabilization ahead of Friday’s CPI.
Bear: Price fails to reclaim $4,361 within the next two NY candles and closes below $4,325 → trend continuation targets $4,307, with further extension possible if the 30-year Bond Auction at 20:01 UTC+3 produces weak demand and pushes long yields higher.
Chart Analysis
The 15-minute chart as of 15:40 UTC+3 tells an unambiguous story: a controlled two-day distribution that resolved violently to the downside on the PPI release. The labeled levels on the chart — $4,404, $4,403, $4,386, $4,383, $4,368, and $4,361 — have all been violated in sequence, with the final breakdown leg producing a near-vertical candle from $4,383 to $4,325, the session low. All three moving averages (green, orange, and blue) are now steeply declining and positioned well above price, acting as compounding resistance on any recovery attempt. The Bollinger Bands have blown out to the downside, consistent with a momentum-driven impulsive move rather than a corrective pullback. There is no visible support structure between $4,325 and $4,307 on this timeframe. The projected path into the NY close remains bearish unless price can reclaim $4,361 on a closing basis — a level that now represents the first meaningful overhead test for any recovery attempt.
New York Close & Asian Session Outlook
NY Close
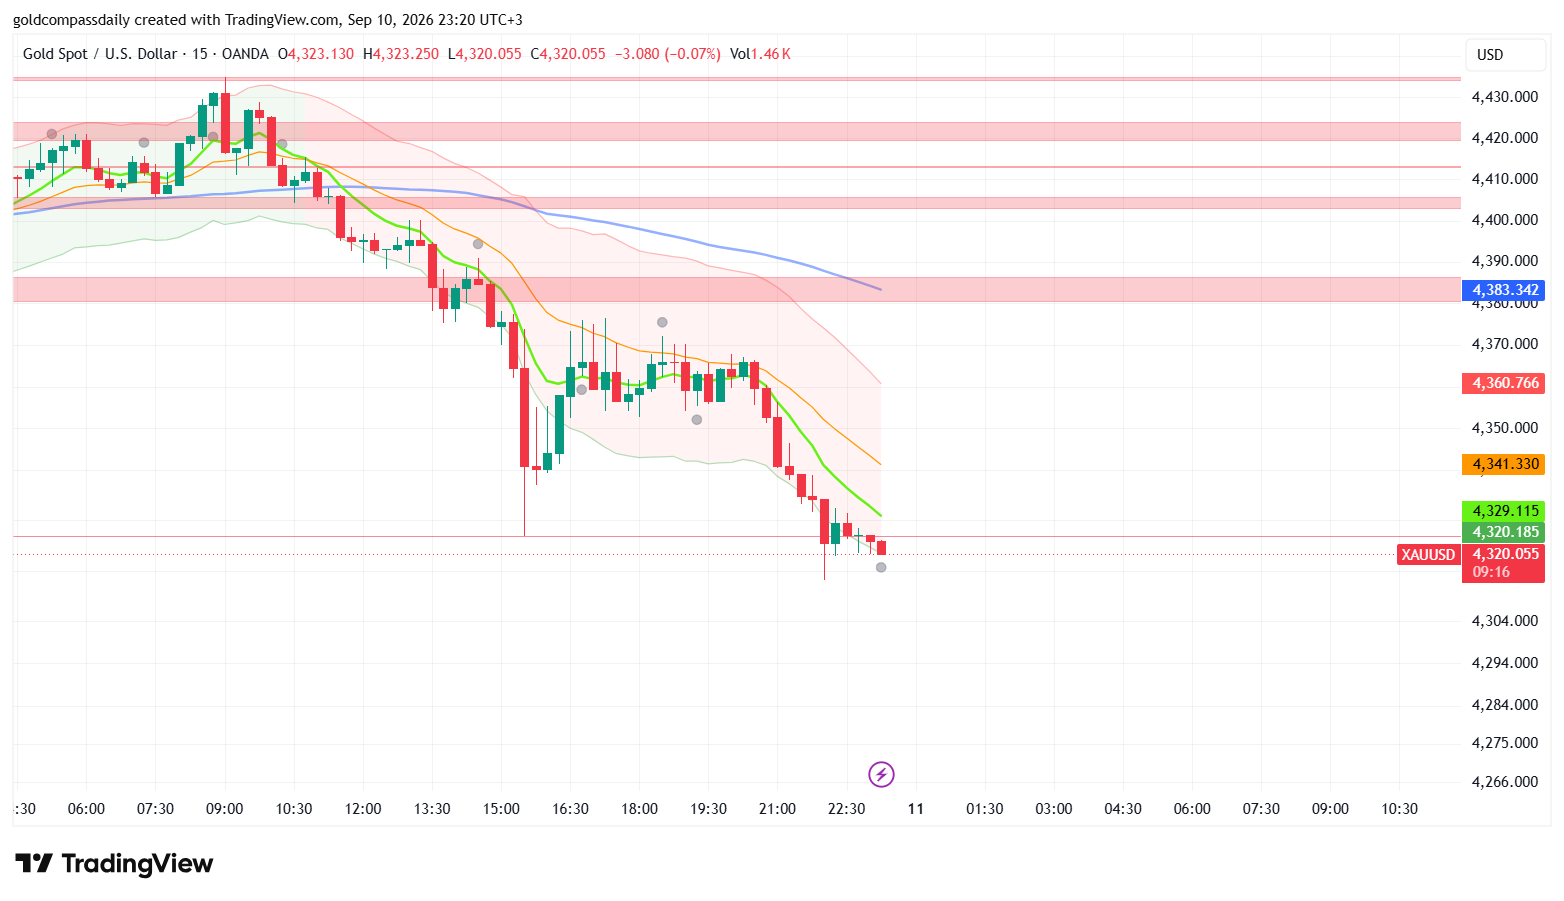
Gold closed the New York session at $4,320 — deeply bearish — fully invalidating Gold Compass Daily’s morning buy thesis as price shed $99 from the $4,419 open to register the session’s worst single-day decline of the week. The $4,397 structural invalidation level identified at the morning open proved prescient: once breached, no meaningful support contained the move.
Updated Key Levels
- NY Close: $4,320
- Session high: $4,432 | Session low: $4,320
- Bias into Asian session: Bearish below $4,341
- Asian session support: $4,320 → $4,307
- Asian session resistance: $4,329 → $4,341 → $4,361
Chart Read at Close
The 15-minute chart at 23:20 UTC+3 presents an unambiguously bearish structure. Price closed at $4,320, sitting at the session low with all three moving averages — green, orange, and blue — steeply declining and stacked well above current price, forming a compressing resistance shelf between $4,329 and $4,383. The Bollinger Bands remain fully expanded to the downside with no mean-reversion signal visible, indicating momentum has not yet exhausted. The green demand zone on the chart, marked near $4,329, has been breached and is now acting as immediate resistance rather than support. The closing candles show persistent seller control with minimal wick recovery — buyers have not stepped in at current levels. The chart’s projected path arrow, curling lower from the $4,341 area, points toward continuation into the $4,307 zone as the next structural reference.
Asian Session Outlook
The Asian session (00:00–09:00 UTC+3) is most likely to produce one of two behaviors: a low-volume consolidation range between $4,307 and $4,329 as markets digest the PPI-driven selloff, or a liquidity sweep below the $4,320 NY low before any recovery attempt. Given the absence of major Asian macro catalysts overnight, a range-bound session with a downward bias is the base case. The level Asian session is most likely to test is $4,307 — the chart extension below the NY close with no visible structural support between the two. A sweep of NY lows before London open is probable, particularly if US Treasury yields hold overnight gains following today’s PPI print.
Next Day Bull / Bear Scenarios
Bull trigger: Price reclaims $4,341 on a 15-minute close during the London open, confirming a failed breakdown → short-covering rally targets $4,361, with $4,383 as the level that would signal a genuine session reversal ahead of Friday’s CPI data.
Bear trigger: Price fails to hold $4,320 on the Asian open and closes a 15-minute candle below $4,307 → trend continuation targets $4,284–$4,290, the next visible structural zone below the current breakdown range.
Tomorrow’s Key Events
- 15:30 UTC+3 — US CPI m/m and y/y (forecast: key): The week’s highest-impact event for gold — a soft CPI print is the only near-term catalyst capable of reversing today’s PPI-driven selloff and restoring the bullish structure; a hot print confirms the bear trend extension toward $4,284.
- 15:30 UTC+3 — US Core CPI m/m: The Fed-preferred inflation sub-component; a miss here carries greater weight for rate cut repricing than the headline figure.
- 17:00 UTC+3 — UoM Consumer Sentiment + Inflation Expectations: Secondary input — elevated inflation expectations would compound gold’s headwinds from today’s PPI data.
Analysis based on the XAU/USD 15-minute chart as of September 10, 2026, 08:20 UTC+3. This article is for informational and educational purposes only and does not constitute financial advice.