

Gold trades cautiously bullish at $4,263 on Thursday, August 6, consolidating just beneath Wednesday’s session high of $4,266 as markets await this afternoon’s US Unemployment Claims print. The metal absorbed overnight pressure with composure, holding well above the $4,245 structural floor, and the 15-minute chart pattern favours a continuation push toward $4,300 if labour data disappoints on the jobs front.
For the broader weekly context, see the Gold Week Ahead: August 3–7, 2026 hub. Wednesday’s session analysis is available here: Gold Surges to $4,176 — ADP and ISM Services in Focus.
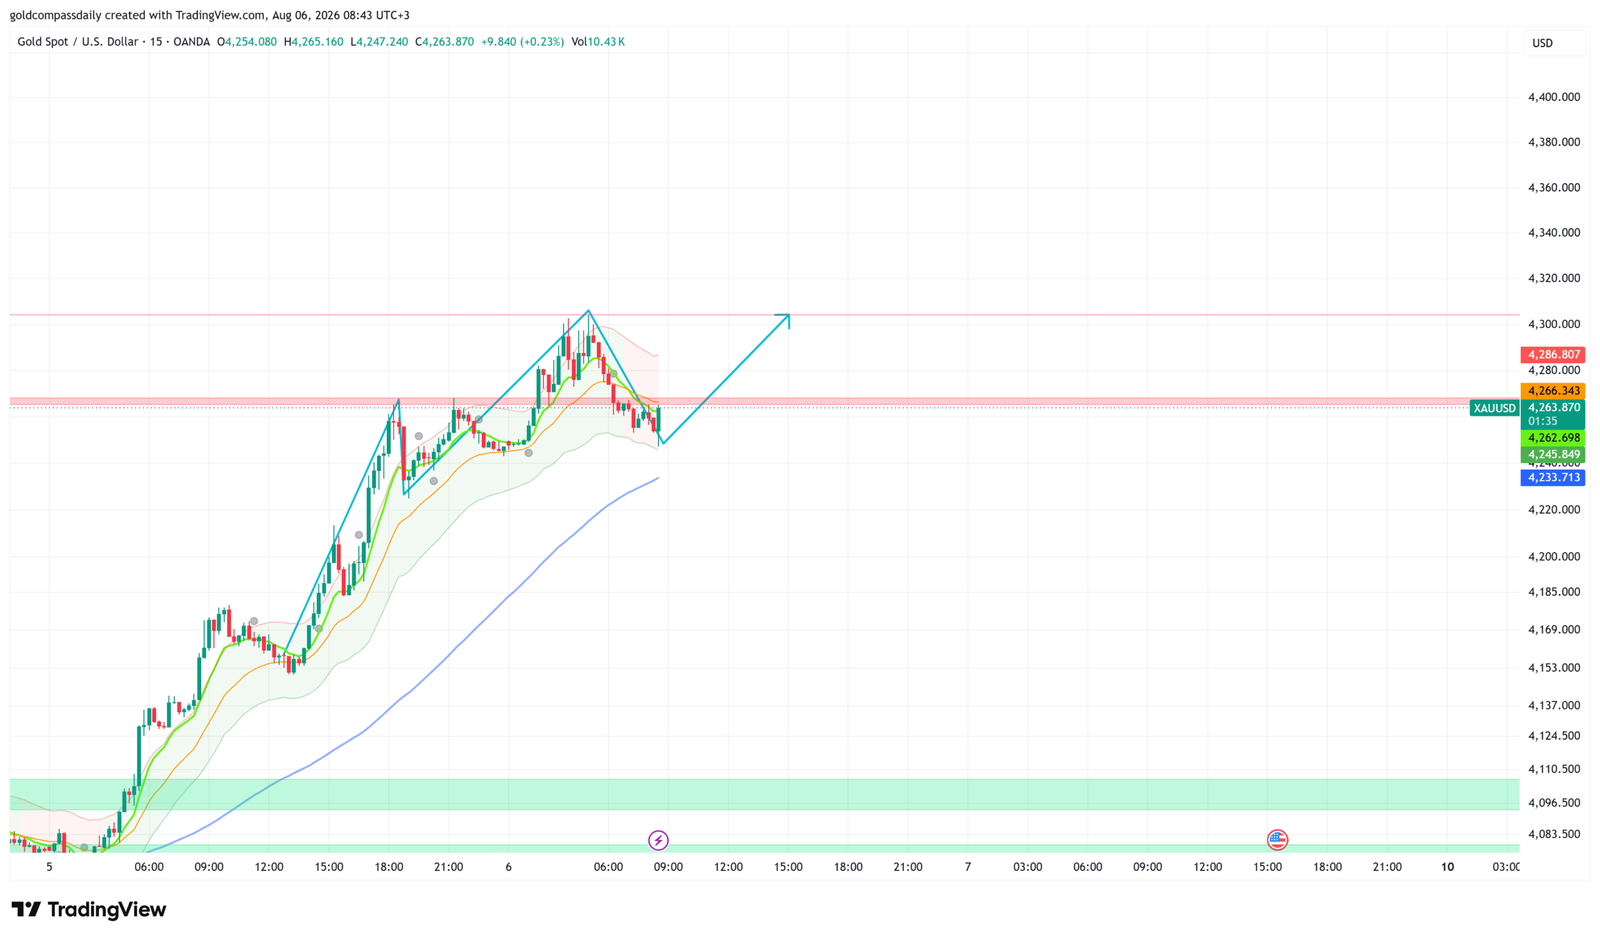
Key Levels
- Bias: Bullish above $4,245
- Support: $4,245 → $4,233
- Resistance: $4,266 → $4,280 → $4,287 → $4,300
- Session target: $4,300 (conditional on Claims above 203K or Productivity miss)
- Invalidation: Close below $4,233 = momentum reversal, retreat toward $4,200 possible
Catalyst of the Day
The session’s primary macro event is the US Unemployment Claims release at 3:30pm UTC+3. The consensus forecast sits at 203K, up from last week’s 197K print. A reading above the 203K forecast would signal labour market softening — adding to expectations that the Federal Reserve under Chair Kevin Warsh faces mounting pressure to ease policy sooner than previously guided. For gold, higher claims translate directly into rate-cut probability repricing, which historically compresses real yields and weakens the dollar — both tailwinds for XAU/USD. The same 3:30pm window also brings Preliminary Nonfarm Productivity (forecast 0.6%) and Preliminary Unit Labor Costs (forecast 2.2%); a stronger-than-expected Unit Labor Costs reading would carry stagflationary overtones, another scenario that has historically supported gold demand.
Fundamental Context
Gold’s decisive overnight rally — from the $4,083–$4,097 support cluster to Wednesday’s high above $4,265 — reflects broad dollar fragility and a risk-off undercurrent building across global markets. The Federal Reserve under Chair Kevin Warsh has maintained a firm hawkish posture rhetorically, yet the accumulating weight of softer US data — including the JOLTS deterioration earlier this week and Wednesday’s mixed ISM Services — has forced market participants to front-run the eventual pivot. FOMC Member Daly’s commentary in the early Asian session (3:35am UTC+3) offered no meaningful policy shift, leaving gold’s macro bid intact.
The international backdrop adds further support. Australian Trade Balance data released overnight showed a deeper-than-forecast deficit, reinforcing the global growth slowdown narrative that historically benefits gold as a reserve asset. The ECB Economic Bulletin due at 11:00am UTC+3 warrants monitoring: any dovish tilt in European policy language would weaken EUR/USD cross rates modestly but would simultaneously reinforce the broader developed-market rate-cutting cycle thesis — a medium-term positive for non-yielding assets like gold. The week’s major event, Friday’s Non-Farm Payrolls, remains the structural risk event that will determine whether gold’s current $4,200–$4,300 range resolves higher or faces a technical reset.
Chart Analysis
The 15-minute OANDA chart as of 08:43 UTC+3 on August 6 shows XAU/USD at $4,263.87, with a session high of $4,265.16 and the overnight peak reaching $4,266. Price launched from the $4,083–$4,097 support band on August 5 and posted an aggressive impulsive rally that peaked just below the $4,266–$4,280 resistance zone — a broad horizontal band visible clearly on the chart. Following the high, a descending wedge consolidation formed, with lower highs converging on the $4,247–$4,263 equilibrium range. Crucially, the fast moving averages (green and orange) have curled upward and are holding beneath current price, the Bollinger Band continues to expand to the upside, and the slow blue MA is rising from well below — all consistent with a structurally bullish trend in the near term. The chart annotation itself projects a continuation leg toward $4,300. The $4,245 level — the lower boundary of the post-spike consolidation range — is the line in the sand for bull positioning. A wedge breakout above $4,266 opens the path toward $4,280, then $4,287, and ultimately the $4,300 psychological target.
Bull / Bear Scenarios
Bull Scenario
Trigger: US Unemployment Claims print above 203K (or Nonfarm Productivity misses at below 0.6%) → price breaks and holds above $4,266 → initial target $4,280, extension toward $4,300 before Friday’s NFP.
Bear Scenario
Trigger: Claims print below 197K (beats strongly, signals labour resilience) or Unit Labor Costs miss to the downside → price fails $4,245 support on a closing 15-minute basis → pullback toward $4,233, with extended weakness risking a retest of $4,200.
Events Ahead
- Thu 11:00am UTC+3 — ECB Economic Bulletin: Tone on European rate path; dovish language strengthens gold’s rate-cut narrative globally.
- Thu 3:30pm UTC+3 — US Unemployment Claims (forecast 203K, prior 197K): Primary catalyst. Above consensus = dollar pressure = gold upside.
- Thu 3:30pm UTC+3 — Prelim Nonfarm Productivity q/q (forecast 0.6%) & Unit Labor Costs q/q (forecast 2.2%): Stagflation signal if costs beat and productivity misses — historically gold-positive.
- Thu 5:00pm UTC+3 — Final Wholesale Inventories m/m (forecast 0.3%): Secondary; confirms or contradicts the demand-slowdown narrative.
- Fri Aug 7 3:30pm UTC+3 — Non-Farm Payrolls: The week’s defining event. A weak print validates the current bullish trend; a strong print is the primary risk to gold’s position above $4,245.
New York Session Update
Gold at $4,244 as of the New York open, having staged a sharp post-Claims reversal that tested the bull thesis before finding support. The morning buy bias remains technically intact but has been stress-tested — price spiked toward the $4,290–$4,295 zone following the data release, then sold off aggressively to a session low near $4,218–$4,220 before recovering.
US Unemployment Claims printed at 227K, well above the 203K consensus — the precise trigger Gold Compass Daily’s morning analysis identified as the bull catalyst. The initial reaction was a sharp rally toward $4,295, consistent with the morning’s $4,300 session target. However, the move was met with heavy profit-taking and stop-running selling that drove price down nearly $75 from the spike high, flushing through the $4,262 and $4,254 support levels before stabilising around the $4,240 gray band visible on the chart. The violent two-way action is consistent with pre-NFP positioning dynamics — traders faded the Claims-driven spike ahead of Friday’s payrolls data, which represents the week’s true directional verdict.
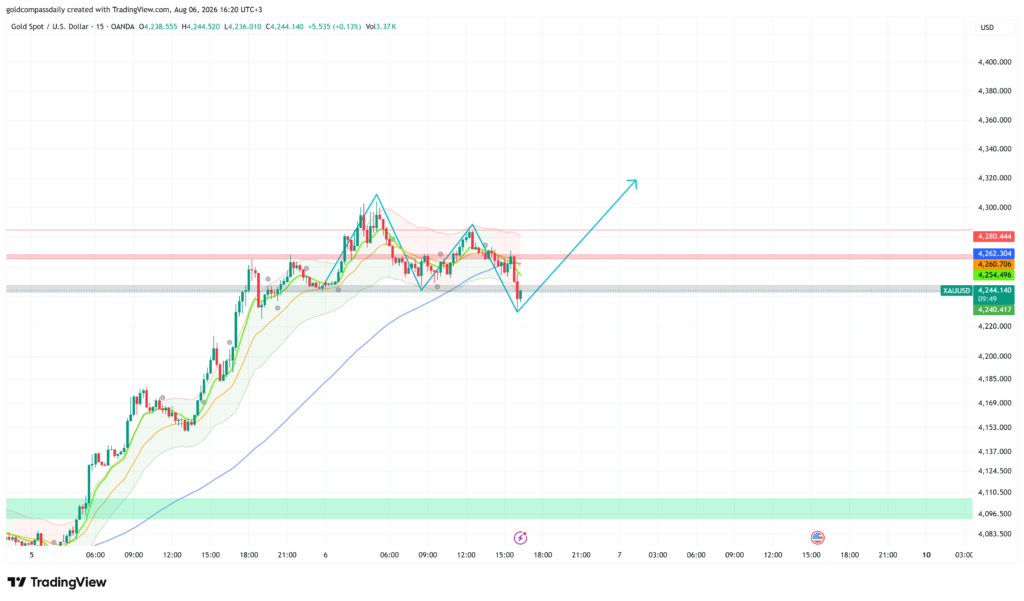
Updated Levels
- Current price: $4,244
- Bias now: Cautiously bullish — morning bias intact but range has compressed; $4,240 is now the critical floor
- Updated support: $4,240 → $4,218–$4,220 (session low)
- Updated resistance: $4,254 → $4,262 → $4,280
- NY session target: $4,262–$4,280 on sustained reclaim of $4,254
Scenarios Into the Close
Bull: Price holds $4,240 and reclaims $4,254 on a closing 15-minute basis → recovery leg toward $4,262 and $4,280 into the afternoon close.
Bear: Failure to reclaim $4,254 and a second close below $4,240 → retest of the $4,218–$4,220 session low, with extended weakness risking $4,200 ahead of NFP.
Chart Analysis
The 15-minute chart as of 16:20 UTC+3 shows XAU/USD at $4,244.14, well off the post-Claims spike high near $4,295 but stabilising above the gray horizontal support band at $4,240–$4,244. The sharp sell-off from the high formed a near-vertical bearish leg that undercut both the $4,262 and $4,254 resistance-turned-support levels, with the session low printing around $4,218–$4,220. Price is now recovering and the chart annotation draws a W-shaped double-bottom structure, projecting a recovery leg that would ultimately target the $4,300–$4,320 area. The fast moving averages (green and orange) were breached on the downside during the flush but price is now reclaiming them from below — a constructive sign if confirmed on the next 15-minute close. The pink resistance band at $4,280 remains the key overhead barrier for the session. A clean reclaim of $4,254 is the minimum requirement before the bull case can be reinstated with confidence.
Analysis based on the XAU/USD 15-minute chart as of August 6, 2026, 08:43 UTC+3. This article is for informational and educational purposes only and does not constitute financial advice.