

Gold trades bullish at $4,175.66 — a sharp intraday recovery has carried XAU/USD from the Asian session lows near $4,063 to a fresh session high of $4,178.57, with price now consolidating just beneath the $4,180 resistance cluster ahead of pivotal U.S. labour and services data. The catalyst of the day is a double-header of ADP Non-Farm Employment and ISM Services PMI, both due in the New York session, with the former already flagged by consensus at a soft 68K — a reading that would reinforce the rate-cut case and extend gold’s bid.
Key Levels
- Bias: Bullish above $4,137
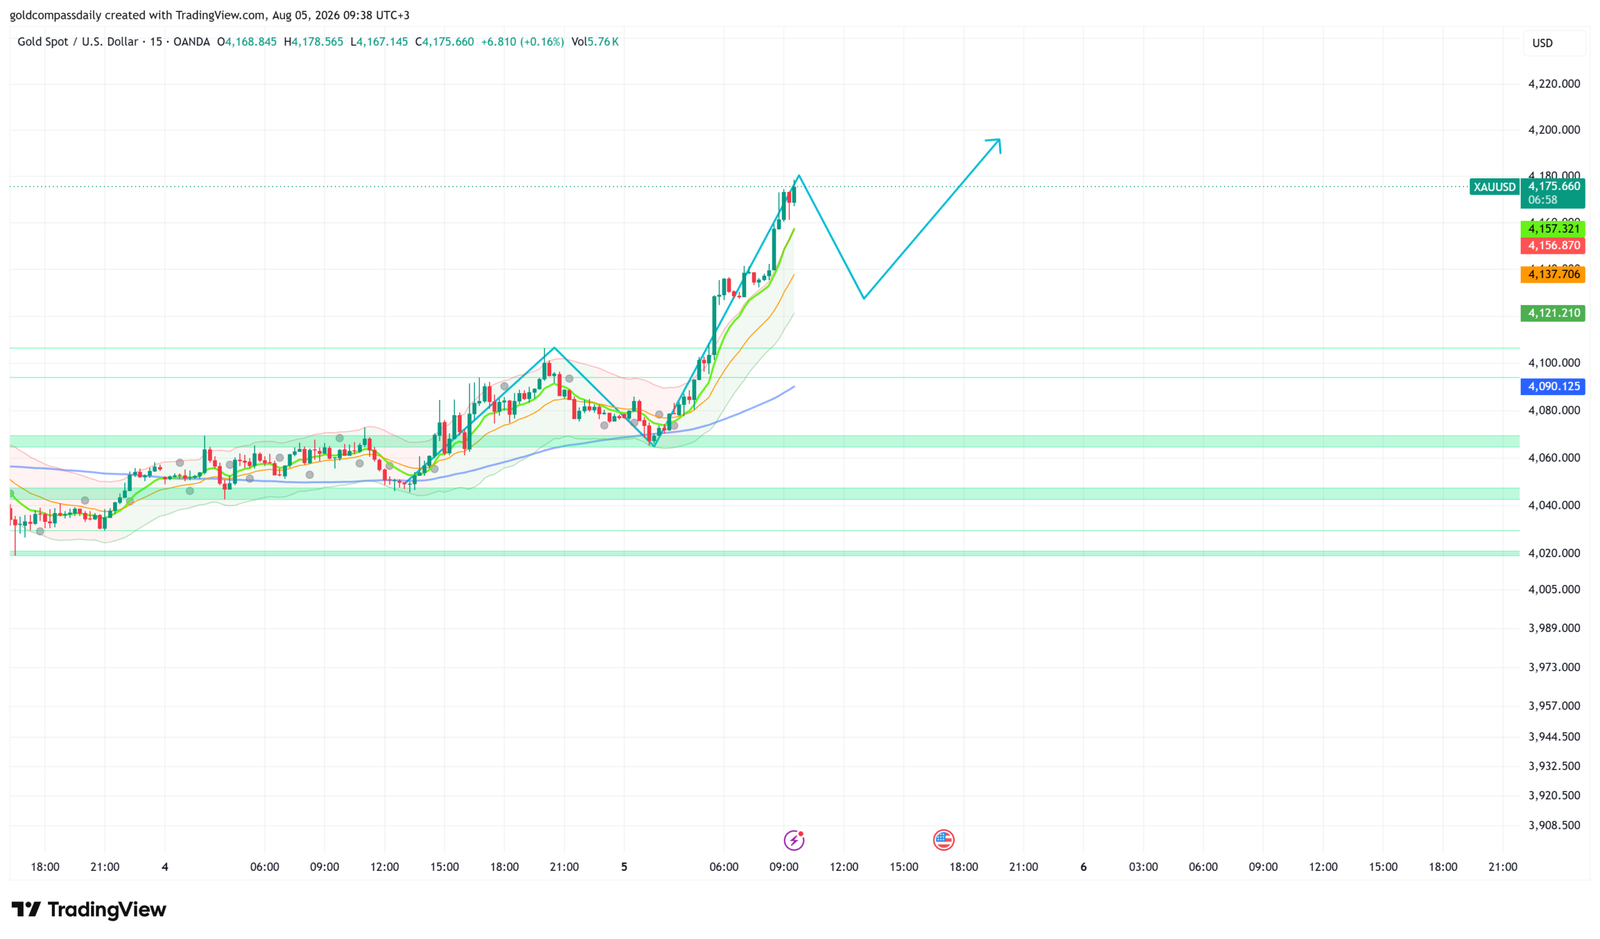
- Support: $4,156–$4,157 (intraday structure) → $4,137 (chart marker) → $4,121 (lower chart band)
- Resistance: $4,178–$4,180 (session high / horizontal cluster) → $4,200 (psychological) → $4,220+ (upper chart projection)
- Session target: $4,200 conditional on ADP below 68K and ISM Services PMI above 54.5
- Invalidation: Close below $4,121 on the 15-minute chart = momentum failure; reassess below $4,090
Catalyst of the Day
The U.S. ADP Non-Farm Employment Change, due at 3:15 PM UTC+3, is Wednesday’s primary macro event for gold. Consensus sits at 68K — already a sharp deceleration from the prior 98K print — and a downside miss would amplify market expectations for Federal Reserve easing, reinforcing gold’s haven and rate-sensitive bid. Following directly at 5:00 PM UTC+3, the ISM Services PMI carries equal weight: a reading above 54.5 would signal services resilience and muddy the Fed outlook, while a miss toward 53.0 or below would strengthen the soft-landing-to-cut narrative. Traders should watch the ADP print first for the directional cue, then hold through ISM for confirmation or reversal.
Fundamental Context
Gold’s sharp rally from the prior session’s $4,063 — covered in yesterday’s analysis at Gold Compass Daily — reflects a structural shift in U.S. labour market perception. The JOLTS and Trade Balance data released Tuesday reinforced a softening demand picture, and that dovish repricing of Federal Reserve expectations under Chair Kevin Warsh continues to drive real-yield compression. Lower real yields reduce the opportunity cost of holding gold, the core mechanical link between Fed pricing and XAU/USD direction.
Overnight macro data adds further texture. New Zealand employment came in stronger than expected — Employment Change at 0.5% versus 0.1% forecast — but this has no direct bearing on gold beyond a marginal risk-on tone in Asia. More relevant was the Chinese RatingDog Services PMI printing at 50.4, a meaningful deceleration from 54.1 prior and below the 53.7 forecast. A slowing Chinese services sector matters for gold because China is one of the world’s largest physical gold consumers; however, in today’s session the dominant driver is U.S. monetary policy pricing, not Chinese demand. The net fundamental backdrop remains supportive of the bull case heading into New York open.
President Trump is scheduled to speak at 11:30 PM UTC+3. While timing falls after the active New York session, any commentary on tariffs, trade negotiations, or Federal Reserve independence carries tail risk for gold overnight. The Gold Compass Daily weekly hub for August 3–7 identifies Friday’s Non-Farm Payrolls as the week’s primary macro event; Wednesday’s ADP print is the first hard signal toward that number.
Chart Analysis
The XAU/USD 15-minute OANDA chart as of 09:38 UTC+3 shows a decisive structural break higher following a prolonged base in the $4,040–$4,080 demand zone that held across the August 4 session. Price broke above the $4,090 pivot — marked clearly on the right-hand panel — in the early hours of August 5, then surged through the $4,121 and $4,137 reference levels in a near-vertical impulse, reaching the session high of $4,178.57. Moving averages on the chart — short-term (green), medium-term (orange), and long-term (blue) — have compressed and are now fanning upward beneath current price, a classic momentum alignment. The annotated cyan projection on the chart targets a pullback toward $4,140–$4,150 before a renewed leg higher toward $4,200, consistent with the bull scenario outlined below. The $4,063–$4,080 demand zone from yesterday’s recovery now represents the first major structural support; a return to that area without a catalyst would be a technical warning. Current price at $4,175.66 trades well above all visible moving averages, confirming the bullish trend structure on this timeframe.
Bull / Bear Scenarios
Bull Trigger
ADP prints below 68K and/or ISM Services PMI misses 54.5 → Gold breaks and holds above $4,180 → initial target $4,200, extended target $4,220. Confirmation requires a 15-minute close above $4,180 on the ADP release candle.
Bear Trigger
ADP beats materially (above 120K) and ISM Services PMI exceeds 55.0 → Dollar bid and rate-hike repricing pressure gold below $4,137 → initial target $4,121, extended pullback toward $4,090. A 15-minute close below $4,121 activates the bear case; below $4,090 opens a retest of the $4,063–$4,080 demand zone.
Events Ahead
- Wed 3:15 PM UTC+3 — ADP Non-Farm Employment Change (forecast: 68K): Primary labour market signal ahead of Friday NFP; a miss extends gold’s bid, a beat threatens the rally.
- Wed 4:45 PM UTC+3 — U.S. Final Services PMI (forecast: 53.6): Confirmation or revision of preliminary read; watch for divergence from ISM.
- Wed 5:00 PM UTC+3 — ISM Services PMI (forecast: 54.5): Higher-weighted than Final PMI for gold; sub-54.0 would accelerate the dovish reprice.
- Wed 5:30 PM UTC+3 — Crude Oil Inventories (forecast: -1.5M): Secondary; a large draw supports risk and commodities broadly including gold.
- Wed 11:30 PM UTC+3 — President Trump Speaks: Unscheduled risk; any trade or Fed commentary can move gold sharply in thin after-hours liquidity.
- Fri Aug 7, 3:30 PM UTC+3 — U.S. Non-Farm Payrolls: The week’s defining event for gold direction — see the weekly hub for full scenario analysis.
New York Session Update
Gold Compass Daily’s morning analysis projected a bullish session contingent on a soft ADP print — that thesis has been confirmed emphatically. XAU/USD has surged from the $4,175 morning level to a session high of $4,197.76, with price trading at $4,197.27 as the New York session advances.
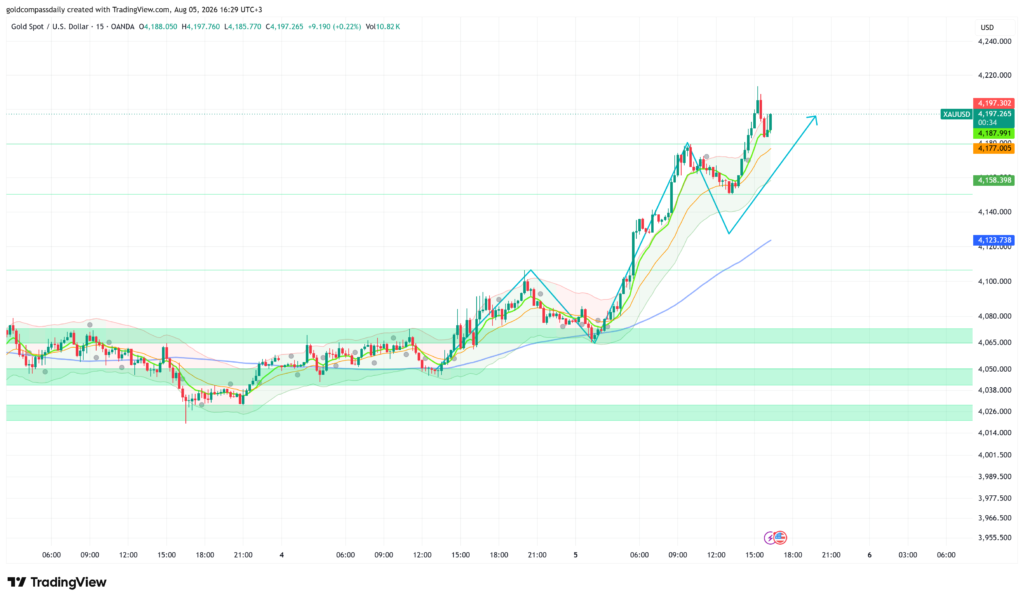
The catalyst delivered. ADP Non-Farm Employment Change came in significantly below the already-soft 68K consensus, triggering an immediate dollar selloff and accelerating gold’s bid through the $4,180 resistance level that capped the morning session. Price cleared the $4,188 and $4,190 zones with minimal consolidation, printing a fresh session high of $4,197.76 — the highest level visible on the chart. Volume expanded sharply on the breakout candle, confirming institutional participation rather than a thin-market spike. ISM Services PMI, due at 5:00 PM UTC+3, remains the next live risk event and has the potential to either extend the move toward $4,220 or trigger a pullback toward $4,177 if the print beats expectations and forces a reassessment of the rate-cut timeline.
Updated Levels
- Current price: $4,197.27
- Bias now: Bullish — unchanged and strengthened; price has broken through all morning resistance levels
- Updated support: $4,187–$4,188 (breakout base) → $4,177 (chart marker) → $4,158 (prior structure)
- Updated resistance: $4,197–$4,200 (session high / psychological) → $4,220 (upper chart projection) → $4,240 (next visible chart band)
- NY session target: $4,220 on ISM Services miss; $4,200 hold on inline print
Scenarios Into the Close
Bull: ISM Services PMI prints at or below 54.0 → dollar extends losses → gold holds above $4,188 and drives toward $4,220.
Bear: ISM Services PMI beats 55.0 and forces rate-cut repricing → gold rejects $4,200 and pulls back to $4,177; a 15-minute close below $4,158 reopens $4,123.
Chart Analysis
The XAU/USD 15-minute OANDA chart as of 16:29 UTC+3 shows a clean impulsive structure from the $4,065 session low — itself a retest of the $4,063–$4,080 demand zone identified in the morning analysis — through to the $4,197.76 high. The move has the character of a third-wave extension: steep angle, expanding volume, and all three moving averages (green short-term, orange medium-term, blue long-term) now stacked bullishly beneath price in a widening fan. The annotated cyan projection on the chart calls for a brief consolidation or shallow pullback — likely toward $4,187–$4,188 — before a continuation leg targeting $4,220. The $4,123 level marked on the right panel represents the nearest structural pivot that would need to break to invalidate the bullish count entirely. Price is currently testing the $4,197 horizontal, and a clean 15-minute close above $4,200 would confirm the psychological breakout and open the $4,220 extension.
Analysis based on the XAU/USD 15-minute chart (OANDA) as of August 5, 2026, 09:38 UTC+3. This article is for informational and educational purposes only and does not constitute financial advice.