

Gold trades cautiously bullish at $4,062 following a sharp intraday recovery from a double-bottom low near $4,019 in early Asian trading on Tuesday. The recovery restores short-term structure and puts the $4,070–$4,074 resistance band back in play, with U.S. JOLTS Job Openings and the Trade Balance serving as the primary macro catalysts for the New York session. The broader bias remains constructive while price holds above $4,048 support.
For the week’s macro framework and NFP context, see the Gold Week Ahead: August 3–7, 2026 hub. Monday’s session analysis is available here: XAU/USD Holds $4,069 as ISM Manufacturing PMI Takes Center Stage.
Key Levels
- Bias: Cautiously Bullish above $4,048
- Support: $4,048–$4,050 → $4,019–$4,021
- Resistance: $4,066 → $4,070–$4,074 → $4,082
- Session target: $4,074–$4,082 (conditional on holding $4,048 and a soft JOLTS print)
- Invalidation: Below $4,048 on a closing basis reopens the $4,019 lows and neutralizes the bull case
Catalyst of the Day
The primary event for Tuesday’s New York session is the U.S. JOLTS Job Openings report (17:00 UTC+3), with the consensus forecast at 7.44 million versus the prior reading of 7.59 million. For gold, JOLTS functions as a leading labor market indicator that directly informs Federal Reserve rate expectations — a weaker-than-expected print would reinforce the case for a more dovish Fed path, pressuring real yields and the dollar, which is directionally bullish for gold. Conversely, an upside surprise would signal continued labor market resilience, reducing the urgency of rate cuts and adding downside pressure to XAU/USD. The U.S. Trade Balance (17:30 UTC+3, forecast -$73.0B versus prior -$77.6B) releases simultaneously and could introduce additional dollar volatility given ongoing tariff sensitivity. Traders should be positioned before 17:00 UTC+3 and watch the dollar index reaction as the first signal of gold’s directional response.
Fundamental Context
Gold’s macro backdrop remains structurally supportive entering August. The Federal Reserve held rates unchanged at its July 29–30 FOMC meeting under Chair Kevin Warsh, reaffirming a data-dependent stance while leaving the door open for a September adjustment. Markets are currently pricing modest probability of a 25 basis-point cut at the September meeting, and that probability moves directly with incoming labor data — making JOLTS today and NFP on Friday the two most consequential near-term inputs for gold. Softer labor data widens the rate-cut window; stronger data narrows it.
Outside the U.S., the session’s data calendar was broadly non-disruptive for gold. Australian Household Spending came in at 0.8% against a 0.2% forecast, reflecting resilient consumer demand, while Japan’s 10-year bond auction cleared at 2.84% — a continued drift higher in Japanese yields that marginally supports the yen and creates mild cross-asset headwinds for dollar-denominated gold. The Canadian Trade Balance (forecast 3.0B) and Manufacturing PMI (forecast 52.2) round out the afternoon slate but are unlikely to drive sustained gold moves absent a significant miss. The dominant driver remains U.S. labor market data and its implication for Fed policy timing.
Chart Analysis
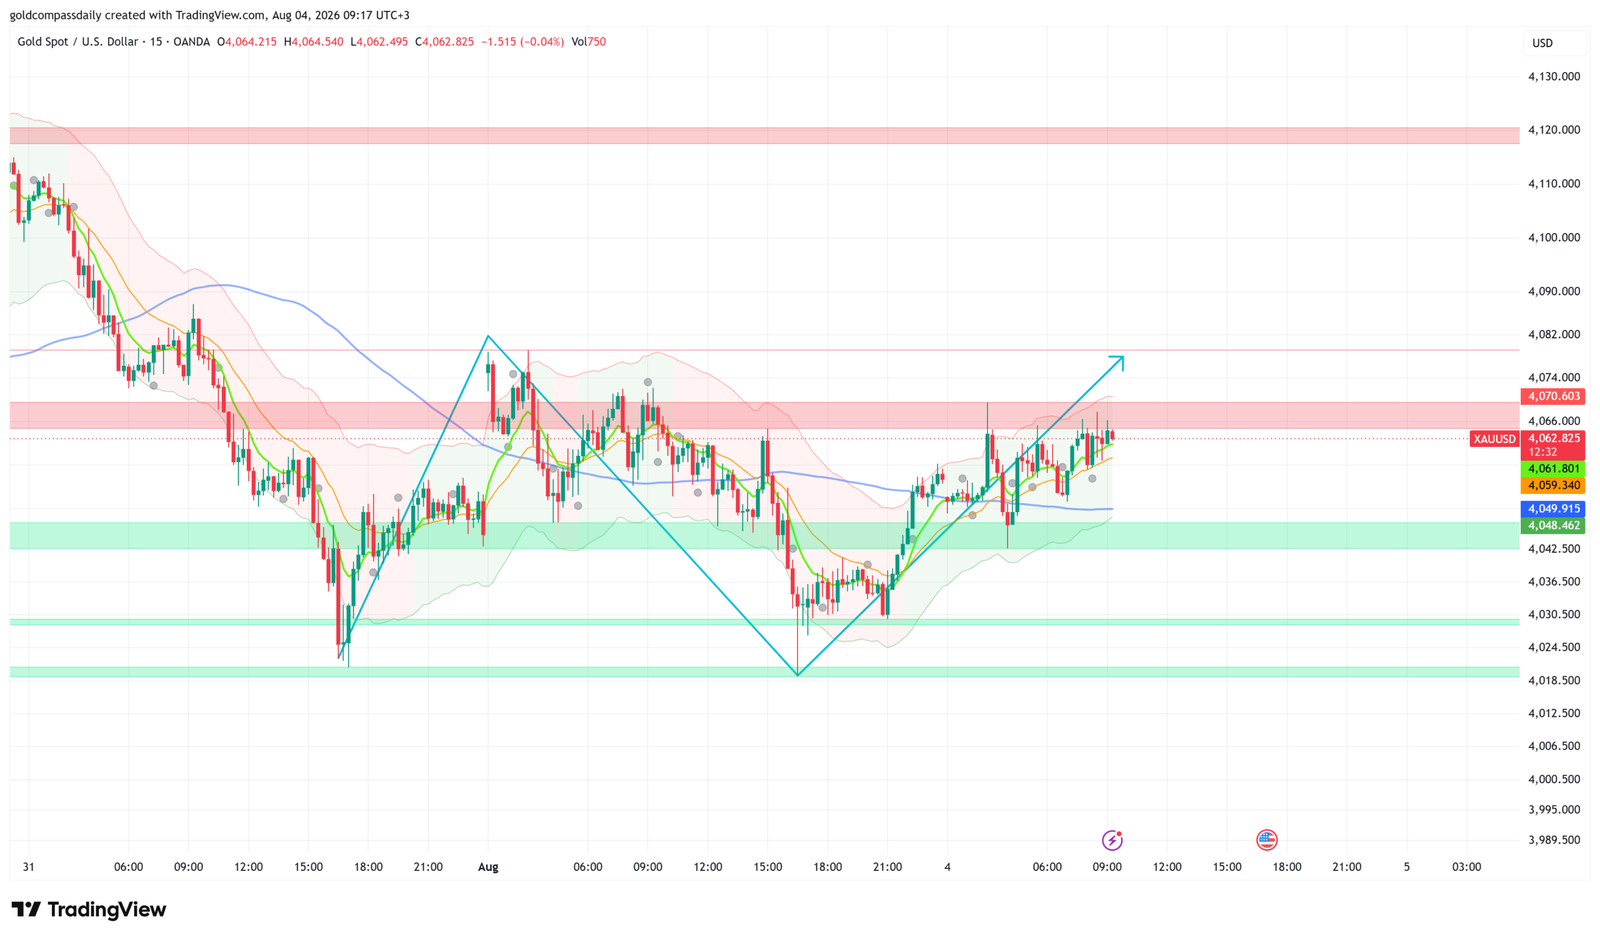
The 15-minute XAU/USD chart (OANDA, as of 09:17 UTC+3) shows a textbook double-bottom pattern completing around the $4,019 support zone in early Asian trading, with the neckline of the pattern sitting near $4,048–$4,050. Price has broken above that neckline and is now consolidating at $4,062–$4,063, just below the key resistance band at $4,070–$4,074 (highlighted in pink on the chart). The short-term EMA stack (green and orange) has turned upward and price is trading above all near-term moving averages, confirming the recovery in short-term momentum. The longer-term blue MA, which was previously acting as resistance near $4,060, is now being tested from below — a sustained close above it adds confidence to the bull case. Bollinger Bands are tightening after the sharp expansion during the sell-off, consistent with a directional move building. The chart’s annotated projection targets the $4,074–$4,082 zone as the measured move from the double-bottom, aligning with the resistance structure visible above current price. The path of least resistance is higher provided $4,048 holds on any retest.
Bull / Bear Scenarios
Bull Scenario
Trigger: Price holds above $4,048 into the New York open and JOLTS prints below 7.44 million → Target: $4,074, extension to $4,082. A confirmed break and close above $4,074 on the 15-minute chart opens the path toward $4,082 and potentially $4,120 on continuation.
Bear Scenario
Trigger: JOLTS surprises to the upside (above 7.59 million) and price breaks and closes below $4,048 on the 15-minute chart → Target: $4,030–$4,019 retest. A loss of $4,019 on a closing basis would damage the broader recovery structure and shift the session bias to bearish.
Events Ahead
- Tuesday, Aug 4 — 17:00 UTC+3 — JOLTS Job Openings (forecast 7.44M): Primary labor market signal for Fed rate-cut timing; direct input for gold’s near-term direction.
- Tuesday, Aug 4 — 17:30 UTC+3 — U.S. Trade Balance (forecast -$73.0B): Tariff-sensitive print; dollar volatility expected on a large miss or beat.
- Tuesday, Aug 4 — 17:30 UTC+3 — Factory Orders m/m (forecast +0.2%): Secondary manufacturing gauge; gold impact limited unless the miss is substantial.
- Wednesday, Aug 5 — U.S. ADP Employment (preview of NFP): First direct read on private payrolls ahead of Friday; high impact for gold if it diverges sharply from consensus.
- Thursday, Aug 6 — U.S. Weekly Jobless Claims: Supplements the labor picture ahead of NFP; persistent elevated claims would be constructive for gold.
- Friday, Aug 7 — 15:30 UTC+3 — U.S. NFP (Non-Farm Payrolls): The week’s dominant event. A miss below consensus would materially increase September cut probability and is the single most important bullish catalyst on the calendar for gold.
New York Session Update
Price Check
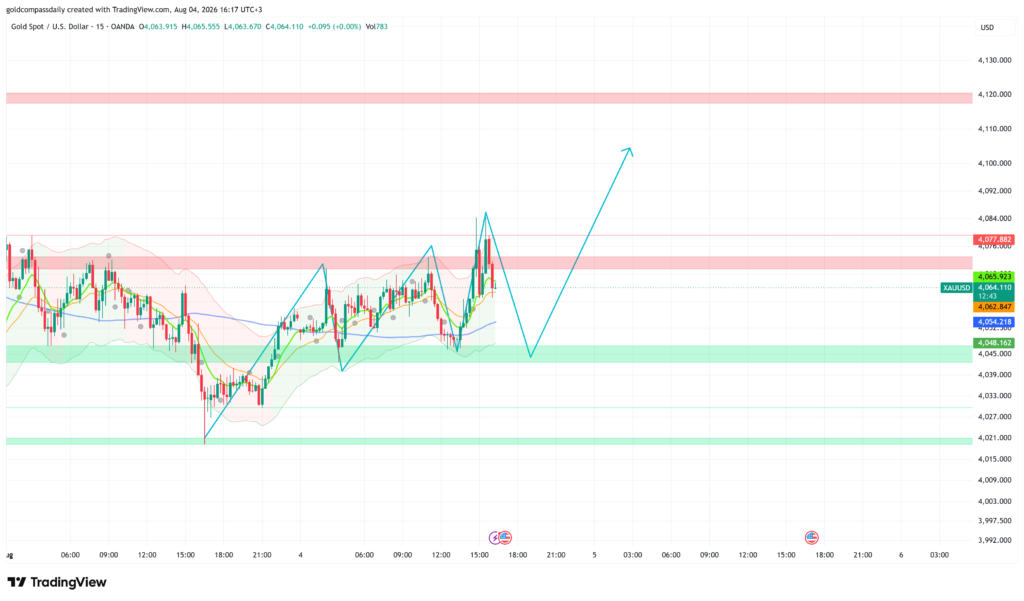
Gold extended the morning recovery thesis, reaching a session high of approximately $4,085 during the early New York session before pulling back sharply to $4,064 — the same level from which the morning analysis was written. The morning buy bias remains technically valid, though the rejection at $4,076–$4,078 resistance introduces a short-term bearish flag that requires monitoring into the close.
What Changed
The JOLTS Job Openings report printed at 7.44 million, in line with consensus, offering no clear directional catalyst for gold on release. Price had already front-run the move higher ahead of the data, reaching $4,085 before sellers re-emerged at the $4,076–$4,078 resistance band. The pullback from $4,085 to $4,064 represents a full round-trip of the NY session’s early gains and has reset short-term momentum indicators. Factory Orders came in at +0.2%, matching consensus, and produced no material dollar reaction. The session’s price action now reflects a market searching for the next directional trigger, with JOLTS failing to provide the sustained dovish impulse needed to clear $4,078 resistance on the first attempt.
Updated Levels
- Current price: $4,064
- Bias: Cautiously Bullish — unchanged, but contingent on holding $4,048
- Updated support: $4,062–$4,048 → $4,021
- Updated resistance: $4,066 → $4,076–$4,078 → $4,085 → $4,120
- NY session target: $4,076–$4,078 on a reclaim; $4,085 on a confirmed break
Scenarios Into the Close
Bull: Price holds above $4,048 on the current pullback and reclaims $4,066 on a 15-minute close → targets $4,076–$4,078, with extension to $4,085 and $4,100 on a confirmed break of the resistance band. Bear: A 15-minute close below $4,048 invalidates the double-bottom structure from the morning and opens a retest of $4,021 support.
Chart Analysis
The 15-minute chart (OANDA, 16:17 UTC+3) shows price rejecting sharply from the $4,076–$4,078 resistance band after reaching a session high near $4,085, with the pullback bringing price back to $4,064 — directly above the short-term EMA cluster. The green and orange EMAs have rolled over on the pullback but remain above the blue longer-term MA, which is now flattening around $4,054–$4,058 and providing dynamic support below current price. The $4,048 green support band remains untested and structurally significant — Gold Compass Daily’s morning analysis identified this as the key invalidation level, and that remains the case. The chart’s cyan projection annotates a pullback into the $4,048–$4,054 zone before a second leg higher targeting $4,100+, consistent with a bull-flag interpretation of the current consolidation. Bollinger Bands are expanding on the downside move, indicating short-term bearish momentum, but the broader structure of higher lows since the $4,021 double-bottom remains intact. A reclaim of $4,066 on the next candle is the immediate signal bulls need to re-engage.
Analysis based on the XAU/USD 15-minute chart as of August 4, 2026, 09:17 UTC+3. This article is for informational and educational purposes only and does not constitute financial advice.