

Headline Thesis
Gold trades Cautiously Bullish at $4,194 — the metal has climbed roughly $75 from the $4,120 floor tracked in yesterday’s report, and the 15-minute structure still favors buyers above $4,150. The Asian session pushed price to the $4,207 area before sellers appeared, so Gold Compass Daily reports a buy-the-dip bias rather than a chase. Today’s University of Michigan sentiment data decides whether the rally extends toward $4,210 or retraces to support.
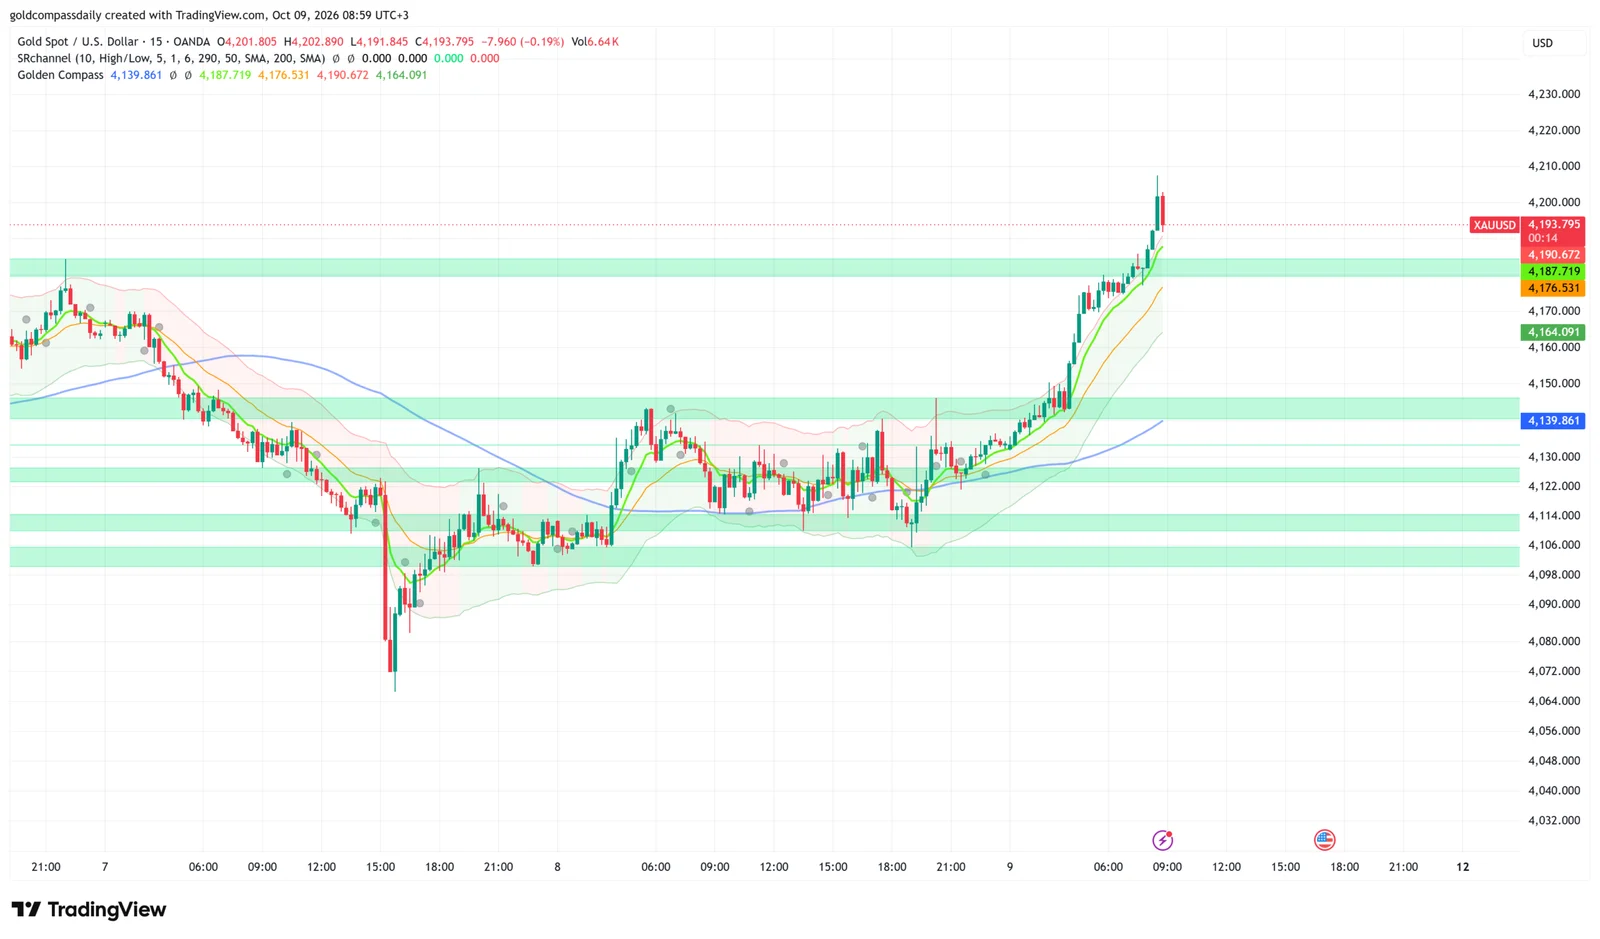
Key Levels
- Bias: Cautiously Bullish above $4,150
- Support: $4,180 → $4,176 → $4,150
- Resistance: $4,200 → $4,210 → $4,230
- Session target: $4,210 (conditional on a soft UoM sentiment print and a dovish tone from Fed’s Collins)
- Invalidation: Below $4,140 = the 200-period SMA and the base of the breakout are lost, and the rally is fully retraced
Catalyst of the Day
The primary catalyst is the preliminary University of Michigan Consumer Sentiment release, because it pairs a growth read with an inflation-expectations read that directly shapes Fed pricing and the real-yield outlook gold trades against. Consensus is 47.5 against 48.1 previously, with inflation expectations last at 4.6%. A weaker sentiment reading alongside sticky or rising inflation expectations supports gold as both a growth hedge and an inflation hedge. A stronger reading with falling inflation expectations removes that support and exposes the pullback zone. Gold Compass Daily will watch the release at 17:00 UTC+3 (10:00 ET) and the inflation-expectations line first.
Fundamental Context
Overnight data was mixed and carried limited direct weight for gold. Japanese household spending fell 3.1% year-on-year, better than the 3.5% decline expected, which signals only a modest improvement in Asian consumption and left gold’s Asian-session advance driven mainly by positioning. Swiss consumer climate is forecast at -32 against -33 previously, and Italian industrial production is forecast flat after 0.7% growth. Soft European activity data keeps the global growth narrative cautious, which is a mild supportive backdrop for safe-haven demand.
The North American data is the more relevant block. Canadian employment is forecast at +6.1K after -41.7K, with the unemployment rate seen at 6.5% against 6.4%. The release at 15:30 UTC+3 can move the US dollar through the CAD cross, and dollar direction feeds straight into XAU/USD ahead of the US data. Fed member Collins speaks at 23:00 UTC+3, after the main session, so the US close may carry a policy-tone risk into the weekend. For the wider setup, see the weekly outlook.
Chart Analysis
The 15-minute chart shows a strong, near-vertical advance from the $4,140–$4,145 zone to a peak near $4,207 on the OANDA feed, just under the $4,210 level from the Asian session. Price now sits at $4,193.80 with the latest candle red and carrying an upper wick, an early sign of profit-taking at the highs. Price is above every moving average on the chart: the fast MA at $4,187.72, the mid MA at $4,176.53, and the 200-period SMA at $4,139.86, which has turned upward and marks the structural floor. The upper channel line at $4,190.67 is now being tested from above, and the lower channel line at $4,164.09 is rising toward price. The key structural imbalance is the thin area between $4,150 and $4,180, where price travelled quickly with little consolidation, so a pullback could fill that gap toward $4,176 and $4,164 before buyers re-engage. The first support is the green zone at $4,179–$4,184, which was resistance earlier in the week and now acts as support. Below it, the $4,140–$4,145 zone and the $4,150 level form the main defense. The chart confirms the $4,150 support and shows the Asian high slightly below $4,210, near $4,207. The projected path is a consolidation or shallow pullback toward $4,176–$4,180, then a retest of $4,200–$4,207 if that support holds.
Bull / Bear Scenarios
Bull trigger: A pullback that holds the $4,176–$4,184 zone, followed by a 15-minute close above $4,207, targets $4,210, then $4,230 if UoM sentiment prints below 47.5.
Bear trigger: A 15-minute close below $4,176 targets $4,164, then $4,150. A close below $4,140 on a strong UoM print invalidates the bullish structure and reopens the $4,125 and $4,110 zones.
Events Ahead
- Fri 15:30 UTC+3 — CAD Employment Change (+6.1K) and Unemployment Rate (6.5%): Moves the dollar through CAD and sets the tone for gold before the US data.
- Fri 17:00 UTC+3 — USD Prelim UoM Consumer Sentiment (47.5) and Inflation Expectations (prior 4.6%): The session’s key catalyst for Fed expectations and real yields.
- Fri All Day — EUR ECOFIN Meetings: Any fiscal or growth headlines can shift euro and dollar flows.
- Fri 23:00 UTC+3 — FOMC Member Collins Speaks: A dovish tone would reinforce weekend safe-haven positioning, and a hawkish one would pressure gold into the close.
The actionable plan for today’s session: buyers favor dips into $4,176–$4,180 with a stop below $4,140, while a break above $4,207 after the UoM release opens $4,210.
New York Session Update
Price Check
Gold trades at $4,184.66, so the morning bias held but lost momentum. Gold Compass Daily’s morning analysis projected a pullback toward $4,176–$4,180 before a retest of the $4,207 high, and price has so far respected that support without reaching the $4,210 target.
What Changed
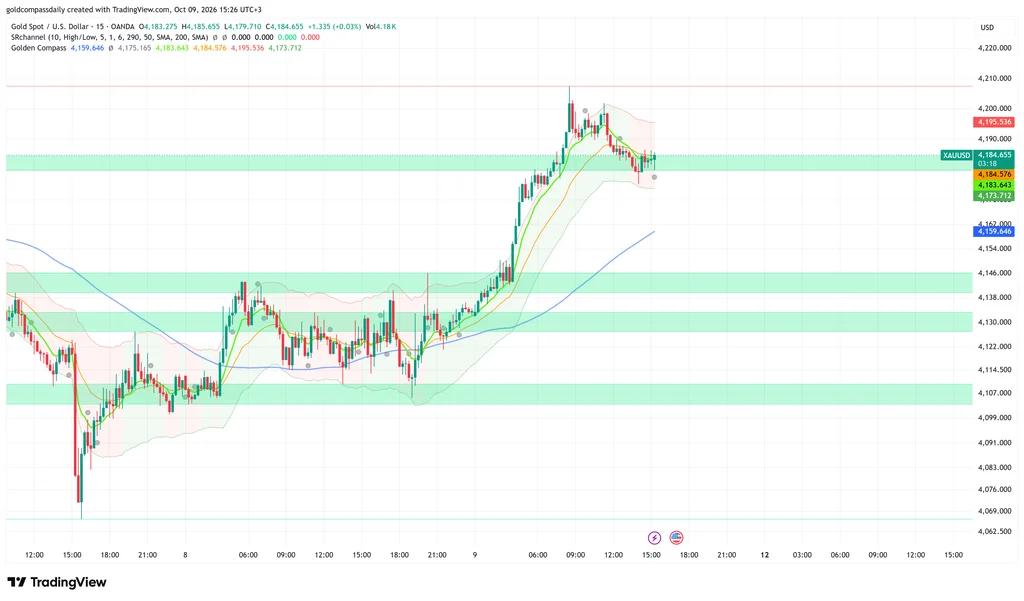
The Asian-session rally to $4,207 did not extend through the European session. Price made a lower high near $4,201 around midday and slid back into the $4,180–$4,185 zone, which was resistance earlier in the week and is now the line the bullish case depends on. The CAD employment release at 15:30 UTC+3 is not yet visible on the chart, so the pullback so far reflects profit-taking rather than a data-driven move. The next catalyst is the preliminary University of Michigan sentiment release at 17:00 UTC+3 (10:00 ET), followed by Fed member Collins at 23:00 UTC+3.
Updated Levels
- Current price: $4,184.66
- Bias now: Cautiously Bullish, unchanged, but conditional on holding the $4,180–$4,185 zone. The morning invalidation at $4,140 has not been tested.
- Updated support: $4,180 → $4,173.70 → $4,159.60 → $4,146
- Updated resistance: $4,195.50 → $4,201 → $4,207
- NY session target: $4,201, then $4,207 on a soft UoM print
Scenarios Into the Close
Bull: A hold above $4,180 and a 15-minute close above $4,195.50 targets $4,201, then a retest of $4,207. Bear: A 15-minute close below $4,180 can quickly slide price toward $4,146, with $4,173.70 and $4,159.60 as interim stops.
Chart Analysis
The 15-minute chart shows price at $4,184.66 sitting inside the green support zone at $4,180–$4,186, after a sharp rally from the $4,140–$4,146 area and a rejection at $4,207. The sequence of highs at $4,207 and then $4,201 points to a fading rally and a rounded top. The fast MA ($4,183.64) has slipped slightly below the mid MA ($4,184.58) and both are flat, with price pinned to them, which signals compression after the rally. The upper channel line ($4,195.54) is sloping down and the lower line ($4,173.71) is rising, so the range is narrowing. The 200-period SMA at $4,159.65 is still rising and remains the structural floor. The main imbalance is the thin area between $4,146 and $4,180, where price moved quickly during the rally and left little consolidation, so a failure of the current zone could fill that gap fast toward $4,159.60 and then the $4,139–$4,146 support zone. The chart confirms the $4,180–$4,185 support and the $4,146 downside target. The projected path is consolidation into the 17:00 UTC+3 UoM release, with a hold above $4,180 keeping $4,195–$4,201 in play and a break below it opening $4,173.70 and $4,146. The actionable level for the close is $4,180: buyers hold above it, and sellers take control on a 15-minute close beneath it.
Analysis based on the XAU/USD 15-minute chart as of October 9, 2026, 08:59 UTC+3. This article is for informational and educational purposes only and does not constitute financial advice.