

Headline Thesis
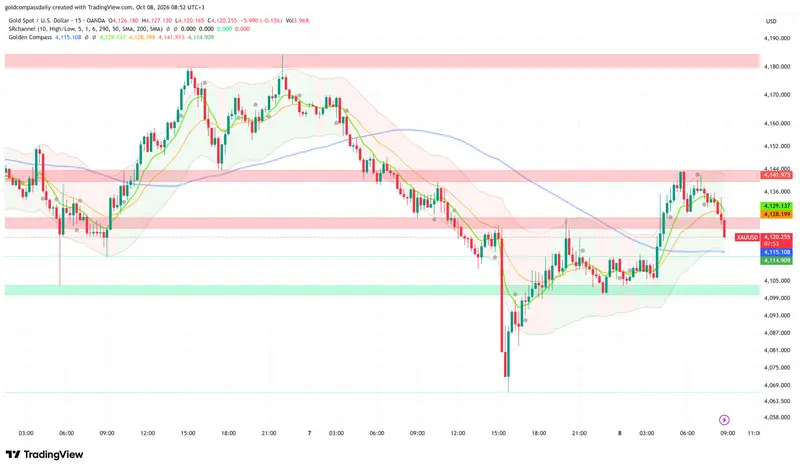
Gold trades cautiously bullish at $4,120 — the 4,099–4,141 channel is intact, and buyers are defending the 200-period moving average after this morning’s rejection at 4,143. Gold Compass Daily reports that a clean hold above 4,115 keeps the path open toward 4,142, while the US jobless claims print at 3:30pm decides whether the channel floor is tested.
Key Levels
- Bias: Cautiously Bullish above $4,099; neutral between $4,099 and $4,115
- Support: $4,115 (200 SMA) → $4,103–$4,099 (channel floor)
- Resistance: $4,128 → $4,142 → $4,152
- Session target: $4,142 (conditional on US jobless claims at or above 210K)
- Invalidation: Below $4,099 = channel breakdown, exposing yesterday’s $4,066 low
Catalyst of the Day
US weekly jobless claims are the priority for gold today. Claims are the first hard labor-market reading after yesterday’s FOMC minutes. They feed directly into rate expectations, and rate expectations drive the opportunity cost of holding non-yielding gold. Consensus sits at 200K against 197K previously. A print at or below 197K signals a resilient labor market, supports Treasury yields and pressures gold toward the 4,115–4,099 zone. A print at or above 210K strengthens the case for easier Fed policy and favors a push through 4,128 toward 4,142. Watch the release at 3:30pm (UTC+3), with FOMC member Waller speaking earlier at 11:30am as a lead-in.
Fundamental Context
Overnight data was mixed for the dollar and supportive for the yen. Japan’s current account surplus came in at 2.98T against a 2.14T forecast, and Economy Watchers Sentiment rose to 47.0 against 46.7 expected. Stronger yen-side data matters for gold because it can weigh on the dollar. The 30-year JGB auction cleared at a 4.11% yield with a 3.9 bid-to-cover, against 4.08% and 3.8 last time. Rising long-end yields globally lift the opportunity cost of holding gold and cap rallies.
The UK RICS House Price Balance fell to -32% against -30% expected, which strengthens the case for BoE easing. The market hears from four MPC members today: Pill, Greene, Lombardelli and Governor Bailey. Dovish commentary would pull global yields lower, which supports gold. Australia’s MI Inflation Expectations rose to 5.3% from 4.9%, a reminder that inflation pressure is not fading everywhere, which keeps the inflation-hedge bid under gold.
Later in the session, the US 30-year bond auction at 8:01pm (previous: 5.31% yield, 2.6 bid-to-cover) and FOMC member Musalem at 8:40pm can move yields into the close. Weak auction demand lifts long-end yields and pressures gold. For context on the broader setup, see the week-ahead outlook on the 4,120 floor and yesterday’s analysis, Gold holds 4,136 ahead of FOMC minutes.
Chart Analysis
The XAU/USD 15-minute chart shows price at $4,120.26, down 0.15% on the latest candle, after a rejection at the 4,141.97 upper band during the early European session. The broader structure is a V-shaped recovery inside a range. Gold sold off sharply from the 4,171 area on October 7 to a low near 4,066, then rebuilt a base at 4,100–4,103 overnight, and that base holds today’s low. The 4,099–4,141 channel is confirmed, with the supply zone at 4,139–4,143 as the ceiling and the 4,100–4,103 demand zone as the floor. Price has slipped back below the 5- and 10-period moving averages (4,129.1 and 4,128.2), which are now turning down. It is testing the 200 SMA at 4,115.1, which sits within a cent of the lower band at 4,114.9, a confluence that makes 4,115 the line in the sand. The 4,123–4,127 band has flipped from support to resistance after today’s drop. The vertical decline from 4,120 to 4,066 on October 7 left thin trading below 4,099, so a failure of the floor could accelerate quickly. The projected path favors a dip into 4,115–4,105, a bounce back to 4,128, then a retest of 4,142, provided 4,099 holds.
Bull / Bear Scenarios
- Bull trigger: A 15-minute close above $4,128 (moving average and band confluence) with claims at or above 210K → $4,142 first, then $4,152 on a break of the supply zone.
- Bear trigger: A 15-minute close below $4,115 with claims at or below 197K → $4,099, and a break of the channel floor → $4,066.
Events Ahead
All times UTC+3.
- Thu 9:00am — German Trade Balance (19.0B): a weaker print adds to eurozone growth concerns and supports safe-haven demand.
- Thu 11:05am — SNB’s Martin speaks: safe-haven currency commentary can move the dollar.
- Thu 11:30am — FOMC’s Waller speaks: the first Fed read after the minutes sets the tone for yields.
- Thu 12:00pm–4:00pm — BoE’s Pill, Greene, Bailey and Lombardelli speak: dovish signals lower global yields.
- Thu 2:30pm — ECB Monetary Policy Meeting Accounts: signals on the ECB rate path affect dollar direction.
- Thu 3:30pm — US Unemployment Claims (200K): the session’s main catalyst for rate expectations and gold.
- Thu 8:01pm — US 30-year Bond Auction (previous 5.31%): weak demand lifts long yields and pressures gold.
- Thu 8:40pm — FOMC’s Musalem speaks: late-session rate commentary can move gold into the close.
Trading Plan
Buy interest is favored on a hold of 4,115, with a stop below 4,099 and a first target at 4,128 and a second at 4,142; stand aside if the 200 SMA fails ahead of the claims print.
London Session Update
Price Check
Gold trades at $4,123.9, within a dollar of the morning’s $4,120 and above the 200 SMA at $4,115.5. Gold Compass Daily’s morning analysis projected a cautiously bullish hold above $4,115, and that bias held through the London open.
What Changed
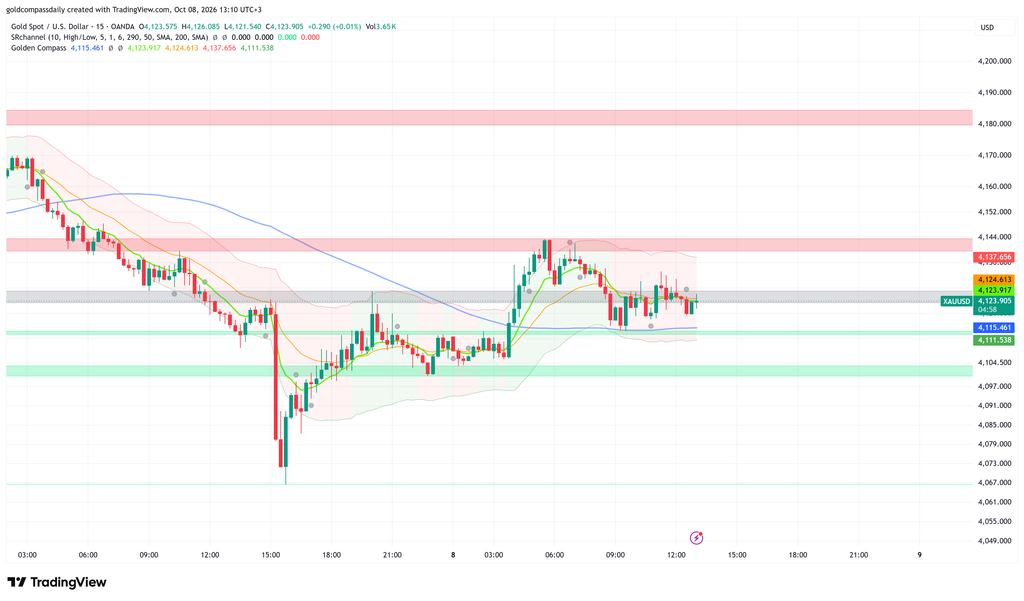
The morning dip toward the 200 SMA was shallower than projected: price slipped to roughly $4,112 near 09:30 (UTC+3) and was bought back immediately, so the $4,115 line was defended rather than broken. Since then gold has compressed into a narrow range of about $4,112–$4,127, with only brief spikes toward $4,130, and the 5- and 10-period moving averages have flattened around price. Buyers are absorbing selling pressure, but no momentum has returned. The $4,139–$4,143 supply zone that rejected price at 05:30 remains untested since the morning, and the next test is the focus for the NY handoff.
Updated Levels
- Current price: $4,123.9
- Bias now: Same, cautiously bullish above $4,115. The 200 SMA held on the morning dip, and the structure of higher lows from $4,066 to $4,100 to $4,112 is intact.
- Updated support: $4,115 (200 SMA) → $4,111 (lower band and session low) → $4,103–$4,099 (demand zone)
- Updated resistance: $4,127–$4,128 → $4,137.7 (upper band) → $4,139–$4,143 (supply zone)
- London session target: $4,138, with $4,142 on a confirmed break above $4,128
Scenarios Into the NY Handoff
Bull: A 15-minute close above $4,128 → $4,138, then $4,142 into the supply zone, with a break of $4,143 opening $4,152. Bear: A 15-minute close below $4,115 → $4,111, and a loss of that level exposes $4,103–$4,099.
Chart Analysis
The XAU/USD 15-minute chart shows price at $4,123.9, moving sideways after the rejection at $4,143 and the V-shaped recovery from the $4,066 low on October 7. The 5- and 10-period moving averages sit at $4,123.9 and $4,124.6, flat and tangled around price, which signals consolidation rather than direction. The 200 SMA at $4,115.5 is flat and sits about $8 below price, and it has acted as the floor on every pullback today. The bands are narrow, running from $4,111.5 to $4,137.7, which points to compressed volatility and a likely expansion once a catalyst arrives. A grey pivot zone at $4,123–$4,127 is where price has spent most of the session, and a decisive close above it is the first sign of strength. Above it, the red supply zone at $4,139–$4,143 is the key ceiling, and further overhead sits $4,180–$4,185. Below, the green demand zone at $4,100–$4,103 is the final cushion before the $4,066 low. The projected path favors a retest of $4,127–$4,128, then a push toward $4,137–$4,143 if the 200 SMA keeps holding. A close below $4,115 would invalidate the near-term structure and shift focus back to $4,111 and $4,103. The levels from the morning analysis are confirmed, with the support band refined to $4,111 and the resistance band to $4,137.7.
New York Session Update
Price Check
Gold trades at $4,119.5, about $4 below the London session’s $4,123.9 and still on the 200 SMA at $4,119.2. Gold Compass Daily’s morning analysis projected a cautiously bullish hold above $4,115, and that bias has held, although without follow-through.
What Changed
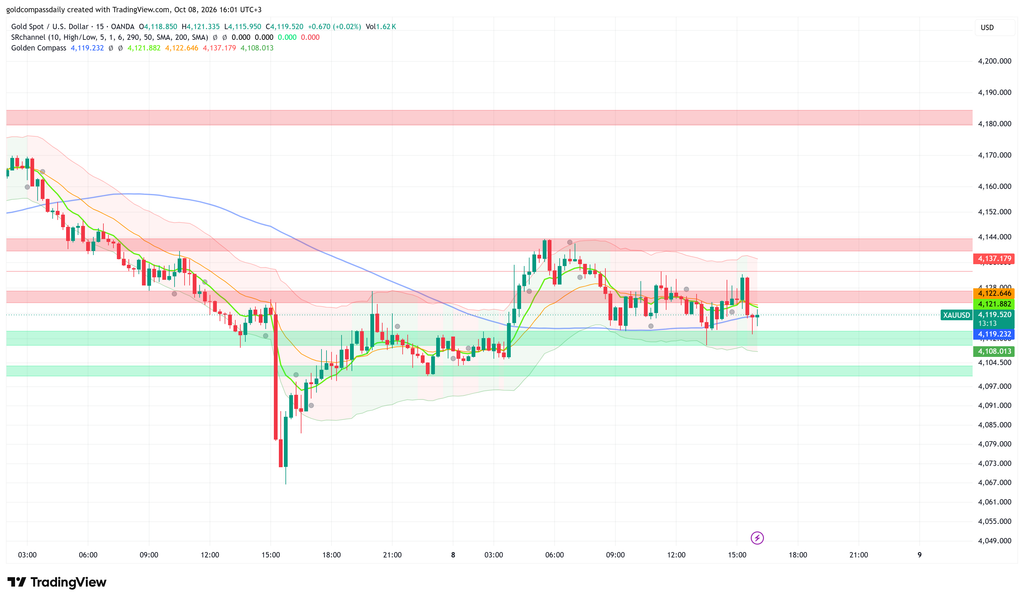
The 200 SMA has changed role since the London update. It was an $8 cushion below price at $4,115.5 and has since risen to $4,119.2, so price now sits directly on it. Buyers made one attempt to break higher near 14:30 (UTC+3), when a spike toward $4,131 reversed within the same hour and erased the gain. A sharp wick to roughly $4,110 followed and recovered, which shows dip buyers remain active. The result is a lower high at $4,131 against $4,143 this morning, with the range compressing around the average. The US jobless claims print at 15:30 has been absorbed without a breakout in either direction, and the market has yet to commit to a direction.
Updated Levels
- Current price: $4,119.5
- Bias now: Cautiously bullish but weakening. The 200 SMA still holds, but the lower high at $4,131 and the failure to hold above $4,127 reduce conviction. The bias converts to neutral on a close below $4,115.
- Updated support: $4,115–$4,116 (recent lows) → $4,108 (lower band) → $4,103–$4,099 (demand zone)
- Updated resistance: $4,122.6 (10-period MA) → $4,127–$4,128 (supply zone) → $4,137 (upper band) → $4,139–$4,143
- NY session target: $4,128 on a hold of the 200 SMA, with $4,137 only on a confirmed break above it
Scenarios Into the Close
Bull: A 15-minute close above $4,128 → $4,137, then the $4,139–$4,143 supply zone. Bear: A 15-minute close below $4,115 → $4,108, and a break of that level exposes $4,103–$4,099.
Chart Analysis
The XAU/USD 15-minute chart shows price at $4,119.5, moving sideways within a $4,108–$4,131 band after the rejection at $4,143 in the early session and the V-shaped recovery from $4,066 on October 7. The 200 SMA at $4,119.2 is now flat to slightly rising and runs through current price, while the 5- and 10-period averages at $4,121.9 and $4,122.6 sit just above price and are rolling over, which gives a mild bearish tilt in the short term. The bands have narrowed to $4,108.0–$4,137.2, which signals compressed volatility and a probable expansion once a catalyst arrives. The pivot zone at $4,123–$4,128 capped the last two advances and now acts as the first resistance, while the demand zones at $4,111–$4,116 and $4,100–$4,103 sit below as support. Wicks on both sides of the range, up to $4,131 and down to $4,110, point to two-way liquidity hunting without a directional winner. The projected path favors continued chop around the 200 SMA until a close beyond $4,128 or $4,115, with the later Musalem remarks and the US 30-year auction the likeliest triggers. The levels from the morning analysis are confirmed, with support adjusted to $4,115 and $4,108 and the upper band to $4,137.
New York Close & Asian Session Outlook
Price Check
Gold trades at $4,136.4, about $16 above the morning’s $4,120 and well above the 200 SMA at $4,126.3. Gold Compass Daily’s morning analysis projected a hold above $4,115 inside the $4,099–$4,141 channel, and that call held through all three sessions.
What Changed
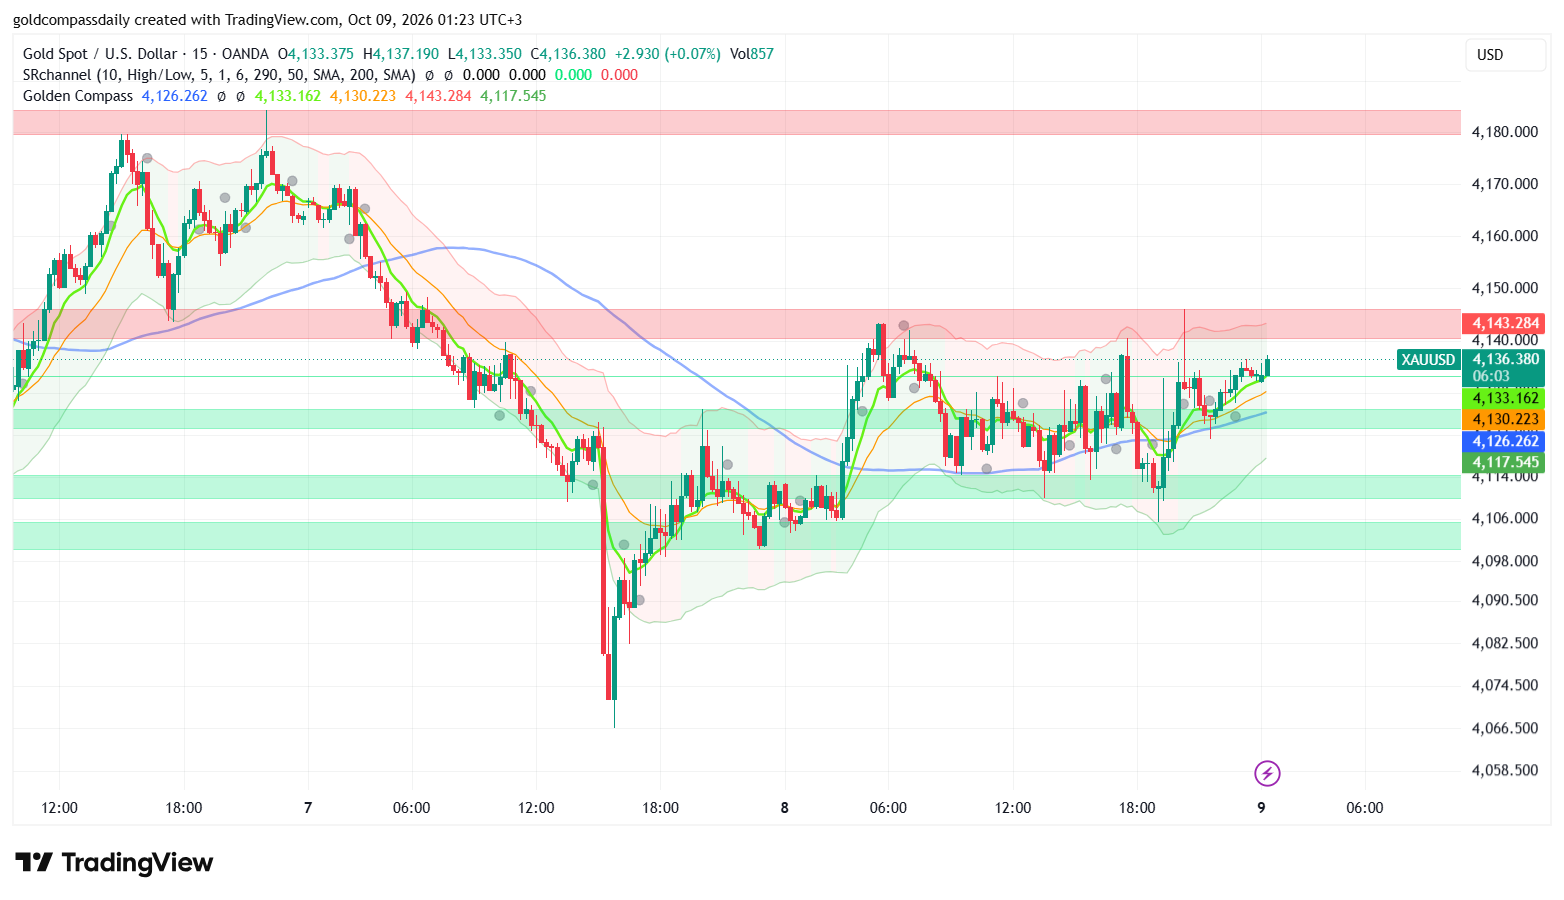
The New York session ended with a flush and a recovery. Gold dipped to about $4,106 near 19:00 (UTC+3), briefly breaking the $4,115 support cited in the earlier update and testing the lower demand zone before buyers pushed it back above the 200 SMA. A spike toward $4,146 followed near 21:00 and was rejected at the upper band and supply zone, so the channel ceiling at $4,141 was breached by a wick and not by a close. Since then gold has built a sequence of higher lows and now trades in the upper half of the session range. The 200 SMA has also climbed from $4,119 this afternoon to $4,126, which lifts the floor under the market by roughly $7 and moves the line in the sand higher.
Updated Levels
- Current price: $4,136.4
- Bias now: Same, cautiously bullish above $4,126. Price sits above the 5-, 10- and 200-period averages, and the $4,106 low was absorbed within minutes. Conviction stays limited until the $4,143–$4,146 supply zone is cleared.
- Updated support: $4,133 (5-period MA) → $4,130 (10-period MA) → $4,126 (200 SMA and demand zone) → $4,117.5 (lower band)
- Updated resistance: $4,143 (upper band) → $4,146 (evening spike high) → $4,180–$4,185 (major supply zone)
- Tomorrow sessions target: $4,143–$4,146, with $4,150 on a confirmed break above it
Scenarios Into the Close
Bull: A 15-minute close above $4,146 → $4,150, then $4,160 as the next open area before the $4,180 zone. Bear: A 15-minute close below $4,126 → $4,117.5, and a loss of that level exposes $4,106.
Chart Analysis
The XAU/USD 15-minute chart shows price at $4,136.4, in a gradual recovery from the $4,106 evening low, which makes the short-term trend mildly bullish within a wider sideways range of roughly $4,106–$4,146. The moving averages are stacked in bullish order, with the 5-period at $4,133.2, the 10-period at $4,130.2 and the 200 SMA at $4,126.3 all sloping upward beneath price, which signals buyers are in control of the short-term structure. The Bollinger-style bands run from $4,117.5 to $4,143.3 and are widening slightly after the evening spike, which signals a pickup in volatility after the narrow afternoon range. Overhead, the red supply zone at $4,141–$4,146 has capped every advance since 05:30 yesterday, and the larger supply block at $4,180–$4,185 sits above it. Below price, the green demand zones at $4,127–$4,131, $4,112–$4,118 and $4,100–$4,106 form a stepped floor, and the evening low held the lowest of these. The projected path favors a retest of $4,143–$4,146 early in the Asian session, with a pullback into $4,130–$4,126 as the more likely scenario if that ceiling rejects price a third time. The levels from the morning analysis are confirmed, with the support band lifted to $4,126 and the resistance band set at $4,143–$4,146.
Analysis based on the XAU/USD 15-minute chart as of October 8, 2026, 08:52 UTC+3. This article is for informational and educational purposes only and does not constitute financial advice.