

Gold trades neutral-to-cautiously bearish at $4,112.98 on Friday — consolidating within a tight $4,108–$4,137 intraday channel after failing to sustain Thursday’s push toward $4,140, with the Fed Monetary Policy Report the final macro catalyst of the week.
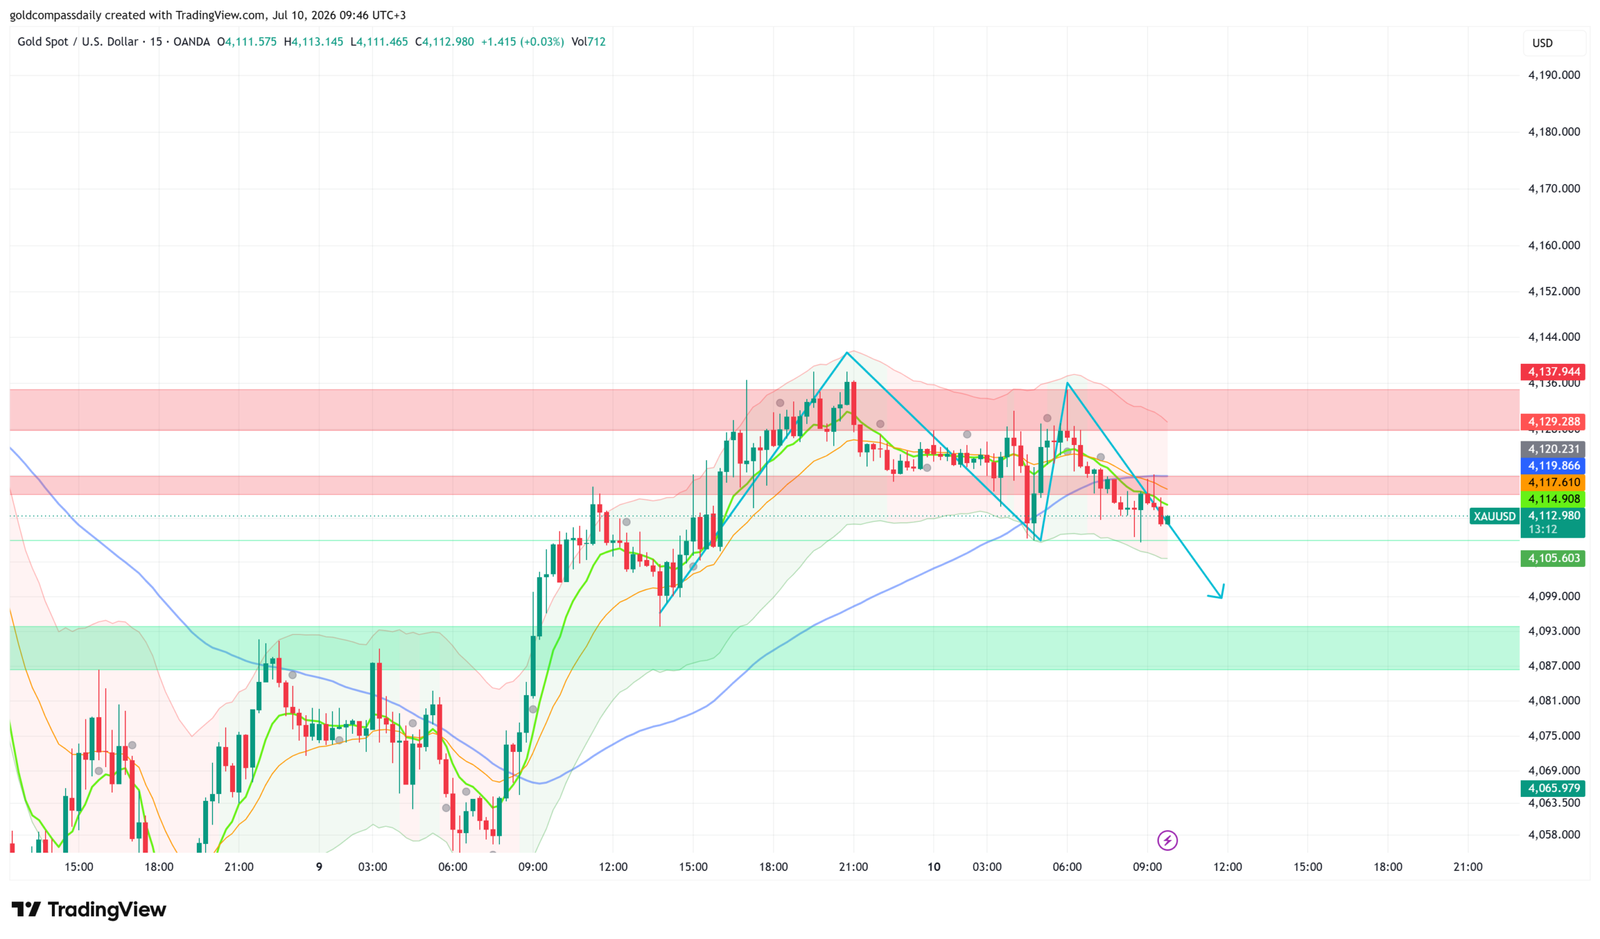
Key Levels
- Bias: Neutral above $4,108 — cautiously bearish below $4,113
- Support: $4,105 → $4,087–$4,093 (green demand zone)
- Resistance: $4,117–$4,120 → $4,129 → $4,137–$4,138
- Session target (bear case): $4,099–$4,105 on a confirmed break below $4,108
- Session target (bull case): $4,129 → $4,137 on a decisive hold and reclaim above $4,120
- Invalidation: A sustained close above $4,138 reopens the $4,152+ range
Catalyst of the Day
The Federal Reserve’s Monetary Policy Report — released on a tentative schedule Friday — is the primary event for gold heading into the New York session. This semi-annual document provides Congress with the Fed’s formal assessment of the economic outlook, inflation trajectory, and the rationale underpinning its current rate stance. For gold, the critical read is whether the report signals any shift in the Fed’s tolerance for prolonged restrictive policy. Language leaning hawkish — reinforcing higher-for-longer — would pressure gold by lifting real yield expectations and supporting the dollar. Dovish framing, particularly any acknowledgment that disinflation is proceeding faster than anticipated, would validate the bull case and push XAU/USD back toward $4,129–$4,137. Traders should monitor for both the release time and any Fed official commentary accompanying the document.
Fundamental Context
Japan’s corporate inflation data released overnight delivered a PPI reading of 7.1% year-on-year for June, ahead of the 6.8% forecast and the prior 6.6% reading. While yen-priced inputs matter primarily for Bank of Japan policy expectations, a persistently elevated Japanese PPI reinforces the global theme of sticky input costs — a backdrop that has historically supported gold as a store of value against structural inflation. The yen’s relative strength trajectory also feeds into cross-asset positioning that indirectly pressures dollar demand.
European data released this morning was broadly in line with consensus. German Final CPI came in at -0.3% month-on-month as expected, confirming June’s seasonal softening without adding new directional information. French Final CPI matched at -0.2%, and Italian Industrial Production showed a slight miss versus prior. The ECOFIN meeting running through the day introduces headline risk around European fiscal policy, but no material surprise is anticipated. The net effect of Friday’s European session data is macro-neutral for gold — the setup leaves XAU/USD entirely in the hands of the Fed Monetary Policy Report and any associated dollar movement into the close.
Canadian employment data at 15:30 UTC+3 adds a secondary USD/CAD input to the session. The Employment Change consensus sits at 11.2K — a sharp deceleration from April’s 87.8K — while the Unemployment Rate is expected flat at 6.6%. A significant Canadian jobs miss would modestly lift the USD in commodity-currency crosses, an indirect headwind for gold. A beat, conversely, reduces CAD-driven dollar demand. Gold Compass Daily treats this release as a secondary catalyst; the Fed Monetary Policy Report carries far greater weight for XAU/USD direction today.
Chart Analysis
The 15-minute chart shows XAU/USD completing a clean impulse leg from the July 9 Asian session lows near $4,065 up to a session peak at $4,137.94 reached during Thursday’s New York window. Since that high, price has been in a controlled pullback, with the current candle printing at $4,112.98 — sitting directly below the clustered resistance band at $4,114–$4,120 (where $4,117.61, $4,119.87, and $4,120.23 levels stack tightly). The short-term moving averages — the green fast MA and the orange mid MA — have crossed bearish and are now declining, with price pressing toward them from above. The blue slow MA sits well below near $4,087, confirming the broader uptrend is intact but the near-term structure is softening. The chart’s projected bearish path (marked with the blue arrow) points toward $4,099–$4,105 as the technical resolution zone should buyers fail to reclaim $4,120. The green demand zone at $4,087–$4,093 remains the structural floor. A pattern of lower highs since the $4,137 peak suggests distribution, not accumulation, within Friday’s early session — consistent with a hold-to-watch bias ahead of the Fed report.
Bull and Bear Scenarios
Bull Trigger
A decisive hourly close above $4,120 — confirmed by volume expansion and a dovish Fed Monetary Policy Report tone — opens a re-test of $4,129 followed by a push toward $4,137–$4,138. A sustained break above $4,138 on a closing basis targets the $4,152 extension. This scenario requires the report to signal the Fed is closer to cutting than current market pricing implies.
Bear Trigger
A clean break and 15-minute close below $4,108 — particularly on a hawkish or neutral Fed report reading — exposes $4,105 first, then the $4,099 level identified in the chart projection. Continuation below $4,099 opens the $4,087–$4,093 demand zone, which would represent a full retracement of Thursday’s breakout gains. This scenario is reinforced if the Canadian employment miss drives additional USD demand.
Events Ahead
- Friday 15:30 UTC+3 — CAD Employment Change (11.2K forecast): A miss widens CAD weakness and modestly supports USD, indirect headwind for gold.
- Friday 15:30 UTC+3 — CAD Unemployment Rate (6.6% forecast): Confirms or undermines the employment picture; watch alongside Employment Change.
- Friday Tentative UTC+3 — USD Fed Monetary Policy Report: The week’s defining event for gold — language on inflation trajectory and rate path sets the directional close for XAU/USD.
For the broader macro context and this week’s full event calendar, see the Gold Week Ahead: July 6–10 hub article. For the prior session’s analysis including Thursday’s claims-driven rebound to $4,101, see XAU/USD Rebounds to $4,101 — Bulls Target $4,120 on Claims Data.
New York Session Update
Price Check
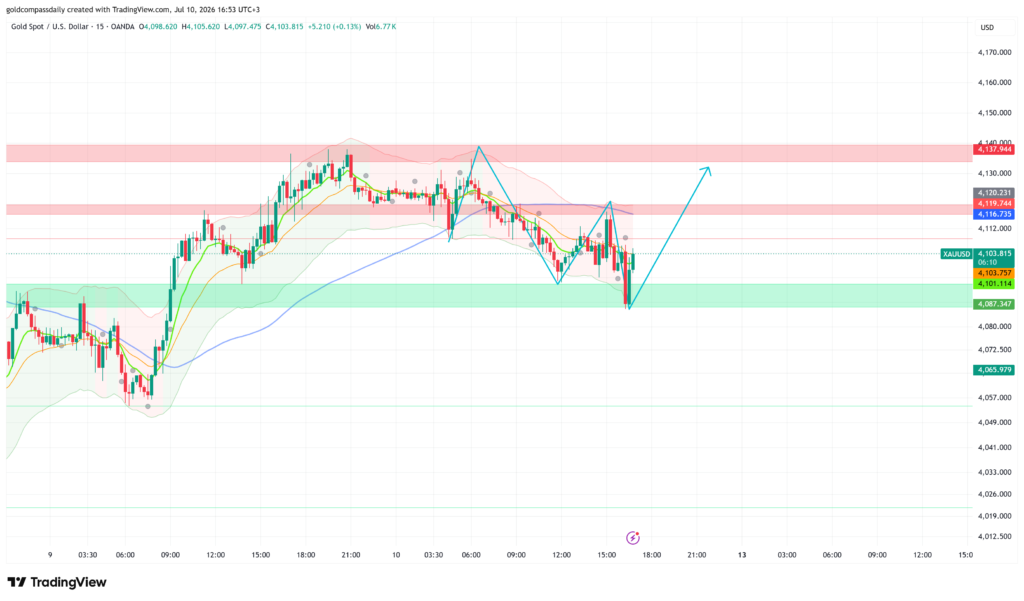
Gold is trading at $4,103.82 as the New York session enters its active window — below the $4,108 floor cited in the morning analysis but holding above the $4,087–$4,101 demand zone that served as the session’s critical structural support. The morning’s neutral-to-cautiously-bearish framing proved directionally accurate through the Asian and early European windows, though the bear leg has so far found containment exactly where the chart structure required it to.
What Changed
The primary development since the morning analysis is the intraday sweep to $4,087.35 — touching the top of the green demand zone visible on the 15-minute chart — followed by an immediate rejection and partial recovery toward $4,103. The move executed the bear scenario outlined this morning (break below $4,108 exposing $4,099–$4,105, then the $4,087–$4,093 zone) almost precisely. The Fed Monetary Policy Report, released on a tentative schedule, has not yet generated a decisive directional catalyst as of 16:53 UTC+3; the market’s muted response suggests the document contained no material surprises relative to existing Fed communication. Canadian employment data — Employment Change of 11.2K forecast — provided a secondary USD input, though any reaction has been absorbed without leaving a lasting dollar bid that would extend gold’s downside. The chart’s projected bull recovery path is now in play from the demand zone low.
Updated Levels
- Current price: $4,103.82
- Bias now: Cautiously bullish from demand zone — recovery attempt underway, requires confirmation above $4,116–$4,120
- Updated support: $4,101 → $4,087 (session low / demand zone top)
- Updated resistance: $4,116–$4,120 → $4,129 → $4,137–$4,138
- NY session target: $4,119–$4,120 on a sustained hold above $4,108; $4,129–$4,137 if NY volume accelerates the recovery
Scenarios Into the Close
Bull: A 15-minute close back above $4,108 and then $4,116 — consistent with the chart’s projected V-recovery path — targets $4,120 first, then a test of $4,137 into the weekly close. Bear: Failure to reclaim $4,108 on the current bounce and a reversal back through $4,101 re-opens the $4,087 demand zone; a confirmed break below $4,087 on a closing basis would signal the week closes with structural damage and shifts the outlook bearish into Monday.
Chart Analysis
The 15-minute chart shows XAU/USD completing the bear leg projected in this morning’s analysis, with the session low printing at $4,087.35 — directly into the green demand zone that spans $4,087–$4,101. Price is currently staging a bounce from that zone, with the blue arrow projection on the chart mapping a recovery sequence: a move back through $4,116, a retest near that level, and then continuation toward $4,137. The fast green MA and orange mid MA remain in a bearish crossover configuration, both declining and sitting near $4,116–$4,119 — meaning those averages now act as dynamic resistance on any bounce. The blue slow MA is pulling up from below around $4,103, providing immediate support to the current candle. Volume at 6.77K is elevated relative to the session average, consistent with the capitulation spike into the $4,087 low. For the bull recovery to gain credibility, price needs to close a 15-minute candle above the $4,116–$4,120 resistance cluster and see the fast MA flatten or curl higher — neither condition is yet met at 16:53 UTC+3.
Analysis based on the XAU/USD 15-minute chart as of July 10, 2026, 09:46 UTC+3. This article is for informational and educational purposes only and does not constitute financial advice.