

Gold trades cautiously bullish at $4,069, consolidating above the key $4,048 demand zone after last week’s sharp recovery from the $4,022 post-FOMC low. The dollar’s residual strength following Chair Kevin Warsh’s hawkish hold creates resistance overhead, but the structural rebound off August lows keeps the bid intact heading into this afternoon’s ISM Manufacturing PMI print.
Key Levels
- Bias: Bullish above $4,048
- Support: $4,048 → $4,028
- Resistance: $4,078 → $4,082 → $4,120
- Session target: $4,082–$4,090 (conditional on ISM Manufacturing PMI miss or soft Prices Paid)
- Invalidation: Below $4,028 = demand structure failure, short-term bearish re-test of $4,000–$4,005
Catalyst of the Day
The US ISM Manufacturing PMI (5:00 PM UTC+3) is the primary catalyst for Monday’s New York session. The consensus forecast sits at 54.0, up from June’s 53.3 reading. Embedded within the release, the ISM Manufacturing Prices component carries equal weight for gold — forecast at 70.0, pulling back from the prior 73.0. A Prices Paid reading that holds above 70 signals persistent input cost inflation, a dynamic historically supportive of gold’s inflation hedge premium. Conversely, a surprise beat on both headline PMI and Prices Paid could reinforce the case for the Federal Reserve to maintain its hawkish posture under Chair Warsh, strengthening the dollar and pressuring gold. The simultaneous release of the Final US Manufacturing PMI (4:45 PM UTC+3, consensus 53.8) will provide the first indication of direction. Watch the Prices Paid sub-index above all else — it is the inflation signal gold traders will price first.
Fundamental Context
Gold enters the week carrying the aftereffects of last week’s FOMC decision, in which the Federal Reserve under Chair Kevin Warsh held rates steady while maintaining a decidedly hawkish forward guidance tone. The policy posture — rates on hold but the threshold for cuts elevated — is a dual-edged environment for gold. Dollar strength derived from a higher-for-longer rate path creates a ceiling, while the absence of imminent tightening prevents outright capitulation in gold prices. The metal’s August 1 session low of approximately $4,022 represented a technical flush of weak longs built ahead of the FOMC decision, and the subsequent recovery signals that structural demand — central bank accumulation, geopolitical uncertainty premium, and persistent inflation expectations — remains the floor.
Monday’s global data calendar adds a geopolitical macro dimension. Japan’s Final Manufacturing PMI came in at 54.5 (unchanged from prior, consensus 54.7), confirming sustained expansion in the world’s third-largest economy. China’s RatingDog Manufacturing PMI printed at 50.9, slightly below the 51.7 prior reading and 51.9 consensus, signaling a modest deceleration in Chinese industrial momentum. A softer Chinese manufacturing pulse historically dampens industrial gold demand expectations at the margin, though this effect is secondary to the USD-rate dynamic today. German Retail Sales for the month disappointed sharply at -1.1% month-on-month versus the -0.4% consensus and a sharp reversal from the +1.1% prior, which underscores European macro fragility and keeps the euro under modest pressure — a dynamic that indirectly supports dollar positioning. For gold, the net read across today’s global PMI releases is mild negative pressure on industrial demand narratives, partially offset by the safe-haven premium embedded in slowing European consumer spending.
Chart Analysis
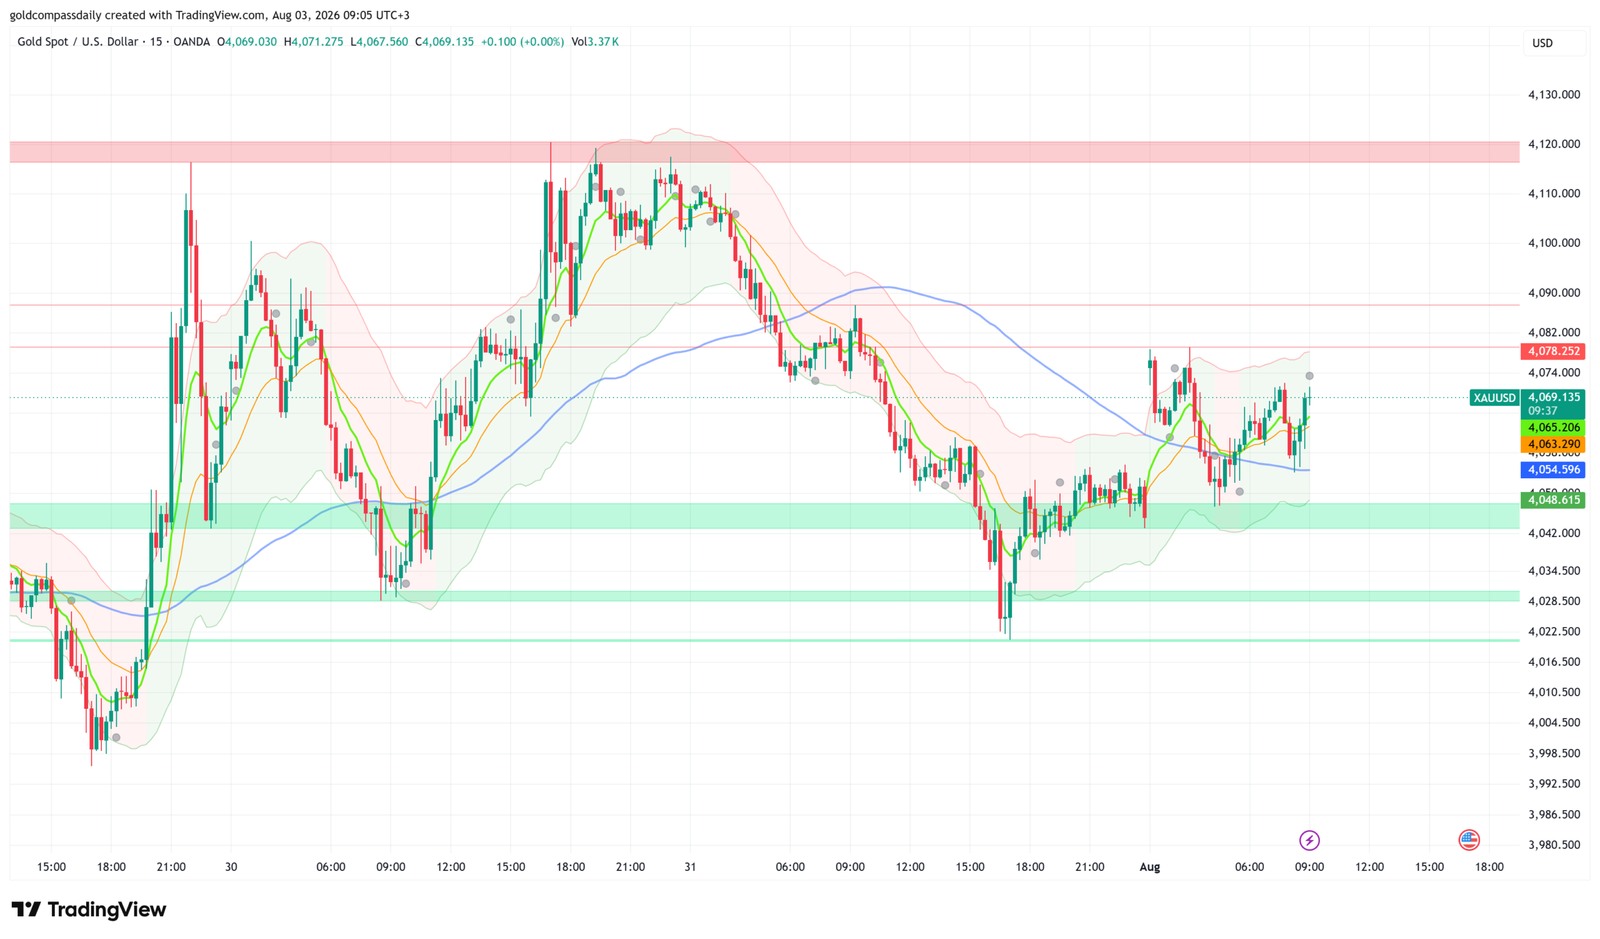
The 15-minute XAU/USD chart (OANDA, as of 09:05 UTC+3) shows gold recovering from the $4,022 structural low established during Friday’s New York session and holding above the $4,048 demand zone — a zone highlighted by the thick horizontal green band that proved decisive on the bounce. Price is currently trading at $4,069, positioned above all three active moving averages: the fast green EMA (approximately $4,065), the mid orange EMA (approximately $4,063), and the slow blue MA (approximately $4,034). The upward curl in the fast and mid EMAs confirms near-term momentum has shifted back to the buy side. Bollinger Bands show a slight expansion, consistent with a directional move attempting to establish. The immediate ceiling sits at the $4,078 horizontal red line visible on the chart, with the session high printed at $4,071. A sustained break above $4,078 opens the path to $4,082 and ultimately the $4,120 resistance zone — the major red band at the top of the chart that capped the July 31 rally. Failure to hold the $4,048 demand zone on any pullback would be structurally negative and shift the near-term bias to neutral. The chart structure overall supports the bullish bias so long as $4,048 holds.
Bull / Bear Scenarios
Bull Scenario
Trigger: ISM Manufacturing PMI misses consensus (below 54.0) and/or Prices Paid decelerates sharply below 70.0 → dollar softens, gold breaks above $4,078 with conviction → Target: $4,090–$4,100. Secondary trigger: European PMI data (Final Eurozone Manufacturing PMI at 11:00 AM UTC+3, consensus 52.0) surprises to the upside, reducing safe-haven demand for dollars as risk sentiment improves and gold benefits from broad USD weakness.
Bear Scenario
Trigger: ISM Manufacturing PMI beats at 54.5 or above, with Prices Paid remaining elevated above 72.0, reinforcing Warsh-era hawkish Fed expectations → dollar strengthens, gold breaks below $4,048 demand zone → Target: $4,028, with extended risk to $4,005. A decisive close below $4,048 on the 15-minute chart would signal the recovery from Friday’s low has stalled and opens a re-test of the weekly demand zone.
Events Ahead
- Monday, Aug 3 — 4:45 PM UTC+3 — Final US Manufacturing PMI (consensus 53.8): First read on US manufacturing momentum; directional lead ahead of ISM.
- Monday, Aug 3 — 5:00 PM UTC+3 — ISM Manufacturing PMI (consensus 54.0) + ISM Manufacturing Prices (consensus 70.0) + Construction Spending (consensus +0.2%): Primary catalyst. ISM Prices is the key sub-component for gold’s inflation premium.
- Monday, Aug 3 — Tentative — Fed Loan Officer Survey: Credit tightening data signals financial conditions; a hawkish read supports dollar over gold.
- Friday, Aug 7 — 3:30 PM UTC+3 — US Non-Farm Payrolls (NFP): Week’s defining macro event. A strong print reinforces the Fed’s higher-for-longer posture; a miss opens the door to rate cut repricing and a gold rally. Full week preview at Gold Week Ahead: August 3–7, 2026 — NFP in the Crosshairs.
New York Session Update
Price Check
Gold is trading at $4,048–$4,053 as New York enters its early session — sitting directly on the $4,048 demand zone identified in this morning’s analysis as the bull/bear line. The morning’s buy bias has not been invalidated, but the metal has failed to make progress toward the $4,078 resistance target and is now testing the floor of the thesis.
What Changed
Since the morning publication, price action has been characterized by a slow, grinding drift lower through the European session rather than the anticipated push toward $4,078. The mid-morning European PMI releases — with the Final Eurozone Manufacturing PMI confirming at 52.0 and German data in line — produced no meaningful catalyst for dollar weakness, leaving gold without a fundamental driver to accelerate the bid. Price has compressed into the $4,048–$4,053 range through the lunch session, with Bollinger Bands narrowing sharply on the 15-minute chart — a technical signal of coiling price action ahead of the day’s primary catalyst. The ISM Manufacturing PMI and Prices Paid print at 5:00 PM UTC+3 now carries the full weight of directional resolution for today’s session.
Updated Levels
- Current price: $4,051
- Bias now: Cautiously bullish — unchanged, but on warning. Price is holding the $4,048 demand zone; a close below on a 15-minute candle shifts bias to neutral
- Updated support: $4,048 → $4,041 → $4,020
- Updated resistance: $4,068 → $4,082 → $4,120
- NY session target: $4,068–$4,074 on ISM miss; $4,028 on ISM beat
Scenarios Into the Close
Bull: ISM Manufacturing PMI comes in below 54.0 and/or Prices Paid drops below 70.0 → gold bounces off $4,048 demand zone, reclaims $4,056 EMAs, and targets $4,068–$4,074 into NY close.
Bear: ISM beats consensus at 54.5 or above with Prices Paid holding above 72.0 → $4,048 demand zone breaks, price accelerates toward $4,028 with $4,020 as the extended target.
Chart Analysis
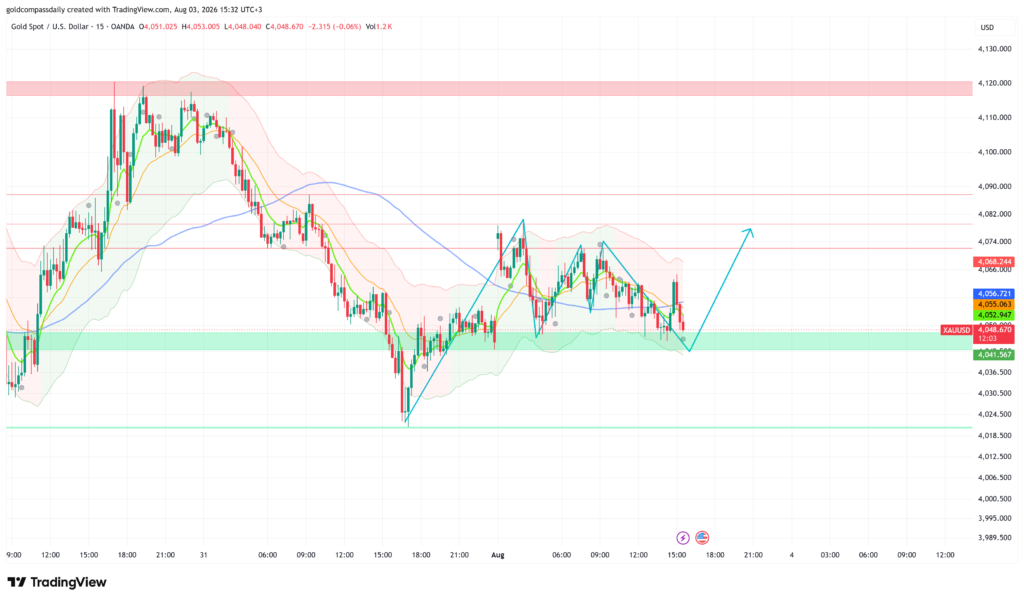
The 15-minute chart as of 15:32 UTC+3 shows gold sitting directly on the $4,048 demand zone — the thick green horizontal band that has served as structural support since the August 1 recovery. Price is now trading below all three moving averages: the fast green EMA (~$4,052), the mid orange EMA (~$4,055), and the slow blue MA (~$4,056), with all three converging and beginning a slight bearish curl — a meaningful deterioration from the bullish EMA configuration seen at the morning’s open. Bollinger Bands have compressed into a narrow range, confirming that the market is coiling ahead of the ISM release rather than trending. Notably, the chart displays a hand-drawn W-pattern (double bottom structure at approximately $4,022 and $4,041–$4,042) with a projected recovery arrow pointing toward the $4,074–$4,082 zone — a scenario that remains valid provided $4,048 holds as support into the data release. Gold Compass Daily’s morning analysis projected $4,090–$4,100 as the bull target on an ISM miss; the updated near-term ceiling given current EMA positioning is $4,068–$4,074 as the first meaningful resistance before that extended target. The $4,048 level is now the line the market is trading on — its integrity in the next two hours defines the session.
Analysis based on the XAU/USD 15-minute chart as of August 3, 2026 at 09:05 UTC+3. This article is for informational and educational purposes only and does not constitute financial advice.