

The RBNZ held its Official Cash Rate at 2.25% as expected. The Monetary Policy Statement and press conference at 6:00am will be the key outputs — any dovish signal about the pace of future cuts, particularly in response to New Zealand’s exposure to both US tariffs and Chinese demand slowdown, would add to the Asia-Pacific easing wave narrative. The MI Leading Index m/m at 0.0% (prior -0.1%) — Australian leading indicators stabilising rather than deteriorating further, a marginal positive.
UBS Economic Expectations: The Morning’s Biggest Positive Surprise
The standout positive of the morning is the Swiss UBS Economic Expectations at -11.1 — dramatically better than the forecast of -30.3 and the prior -30.3. A reading of -11.1 versus an expected -30.3 is one of the largest single-month beats on this survey in recent history. Swiss institutional investors have dramatically revised their economic expectations upward — suggesting that the Liberation Day tariff shock’s psychological impact on European institutional sentiment is fading faster than the PMI data would imply. For EUR/USD and CHF, the UBS beat is mildly positive — it reduces the urgency for SNB intervention and signals that European financial conditions are more resilient than feared. For gold specifically, a recovery in institutional economic optimism is a mild headwind through the reduced safe-haven premium channel — but the improvement is from deeply negative to merely negative (-11.1 still signals below-average expectations).
The Japan SPPI y/y at 3.0% (forecast 3.3%, prior 3.3%) — a miss on Japanese services producer prices. Combined with yesterday’s BOJ Core CPI miss (1.4% vs 1.7%), Japan is showing consistent evidence that its inflationary momentum is losing speed — reducing BOJ rate hike urgency and modestly weakening the yen.
The Chart: $4,477 Is the Line
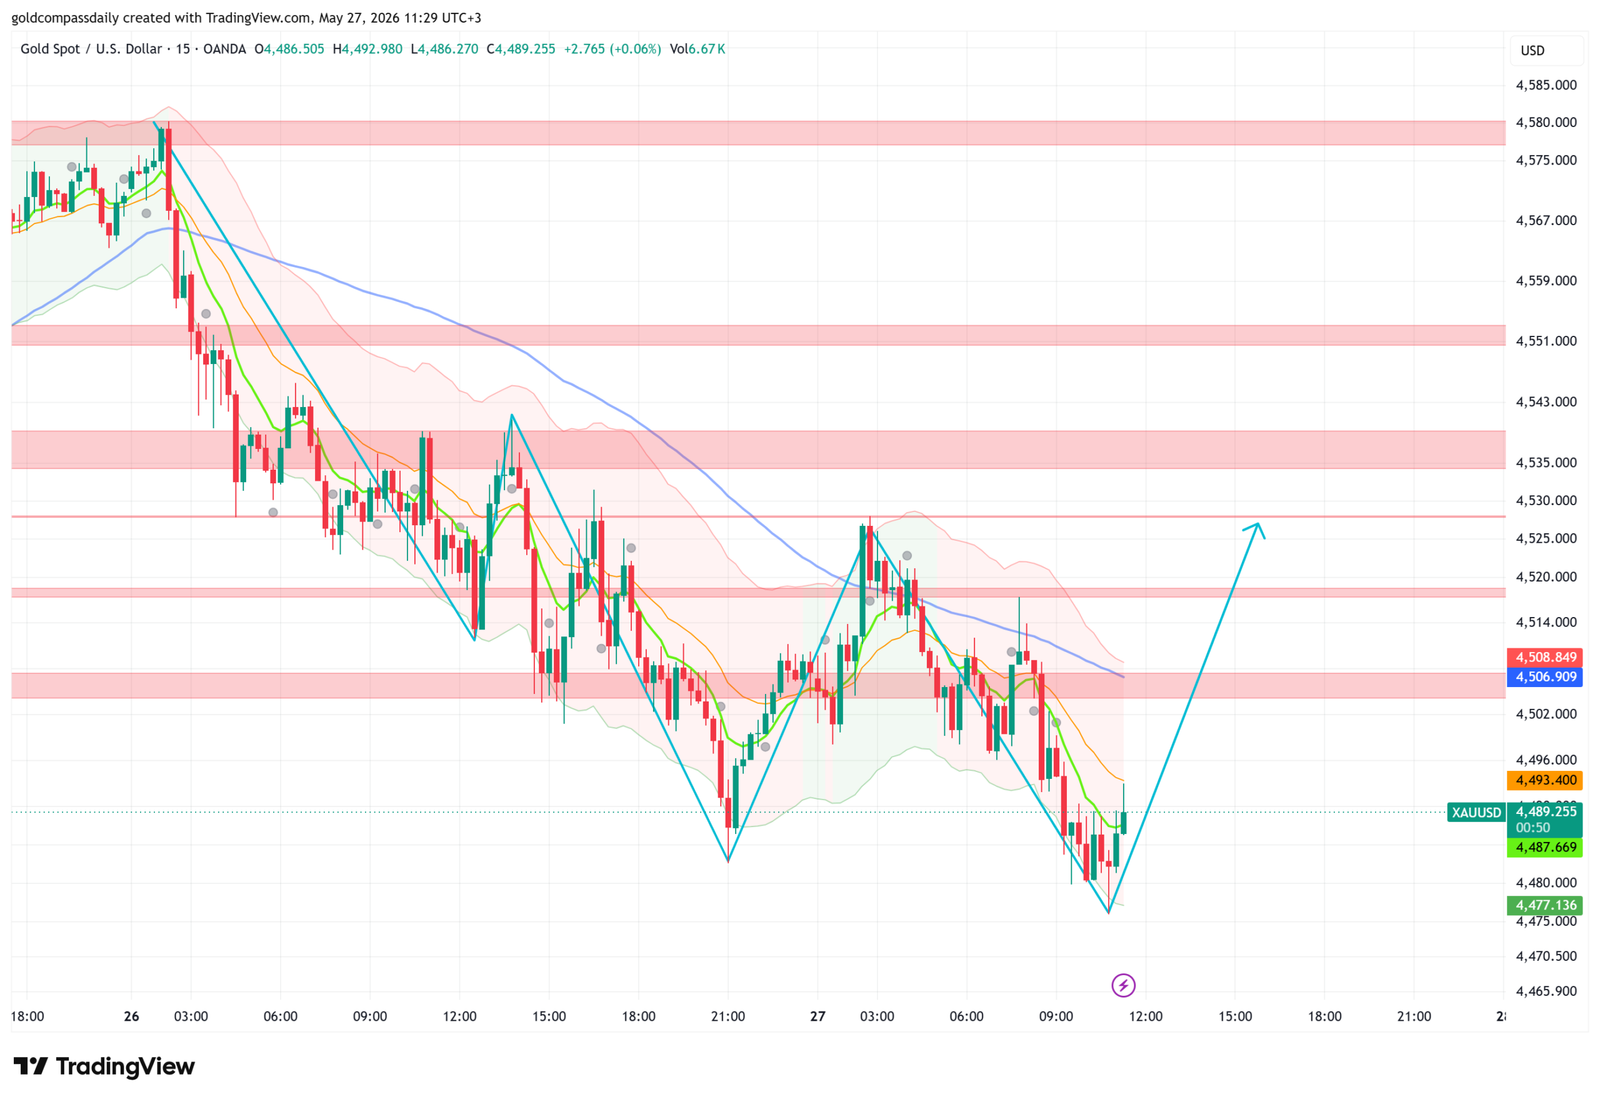
The 15-minute chart shows price testing the green demand zone floor at $4,477.136 — the same level that defined the weekly low last week and has held on two intraday tests today. The structure is a series of lower highs since yesterday’s $4,575 peak, but the lower lows have consistently found buyers at the $4,477–$4,487 zone. The Bollinger Bands are expanded downward but beginning to flatten, and the moving averages — while still pointing lower — are losing their bearish slope. The projected path shows a hold at $4,477 followed by a recovery toward $4,493.400 (immediate resistance), $4,506.909, $4,508.849, and ultimately $4,525+ as the session target.
A close below $4,477 on the 15-minute chart would be a genuine breakdown — it would break the support that has defined the floor since May 19 and open the $4,447 weekly low visible on the 4-hour chart. In that scenario, the $4,374–$4,382 green bands become the next reference ahead of Thursday’s data. A close above $4,508.849 signals the day’s low is in and positions gold for the Thursday data reaction.
Secondary Data: ADP, Richmond Manufacturing, FOMC Logan
The afternoon delivers three US inputs that will refine Thursday’s positioning. ADP Weekly Employment Change at 3:15pm (prior 42.3K) — a third consecutive weak weekly ADP reading below 50K would reinforce the NFP deceleration narrative. The Richmond Manufacturing Index at 5:00pm (forecast 4, prior 3) — US regional manufacturing barely positive after last week’s Philly Fed miss at 1.40. The China CB Leading Index m/m at 4:00pm (prior -0.2%) — China’s forward-looking indicator; a third consecutive negative reading confirms the Q2 Chinese slowdown is accelerating. FOMC Member Logan speaks at 11:00am — her framing of the Australian CPI miss and the RBNZ hold as inputs to the Fed’s global growth assessment will set the USD tone heading into tomorrow’s critical data window. FOMC Member Cook speaks at 10:55pm — the evening’s Fed communication after all US data is in.
Events Ahead
- Tomorrow 3:30pm — The Week’s Defining Moment: Prelim GDP q/q (forecast 2.0%), Core PCE m/m (forecast 0.3%), Unemployment Claims (forecast 211K), Personal Income (forecast 0.4%), Personal Spending (forecast 0.5%), Core Durable Goods (forecast 0.5%), Durable Goods (forecast 4.0%) — all simultaneously. This is the most concentrated US data release of the month. A Core PCE miss below 0.2% + Claims above 225K = gold breaks above $4,535 toward $4,575. A GDP beat above 2.5% + hot Core PCE = gold tests $4,447.
- Full week context: Gold Week Ahead: May 26–30
Key Levels
- Floor: $4,477.136 — hold this to keep the weekly structure intact
- Breakdown trigger: Close below $4,477 → $4,447 weekly low → $4,374–$4,382
- Resistance: $4,493.400 → $4,506.909 → $4,508.849 → $4,525 (session target)
- Recovery trigger: Close above $4,508 = day’s low in, $4,525 next
- Bias: Neutral at support — Australian CPI miss is structurally gold-supportive · Hold $4,477, position for Thursday’s 3:30pm data barrage
Analysis based on the XAU/USD 15-minute chart as of May 27, 2026, 11:29 UTC+3. Economic data sourced from the daily macro calendar. This article is for informational and educational purposes only and does not constitute financial advice.