

Gold trades cautiously bullish at $4,101, recovering sharply from Wednesday’s intraday low of $4,022 in a V-shaped reversal that has price pressing the first meaningful resistance cluster ahead of the US Unemployment Claims release. The near-term structural bias favours continuation toward $4,120–$4,138 provided buyers defend the $4,093 demand zone on any retest. A softer-than-expected claims print is the catalyst that could unlock that move before the New York open.
Editorial note: The input brief references gold having risen to $4,200 and now consolidating. The attached 15-minute chart as of 09:29 UTC+3 on July 9 shows current price at $4,101.085, with a session high of $4,103.29. Gold Compass Daily reports levels as read from the chart; $4,200 may refer to a higher-timeframe context or a forward projection not yet reflected on this chart. All levels in this article are sourced from the attached 15-minute session data.
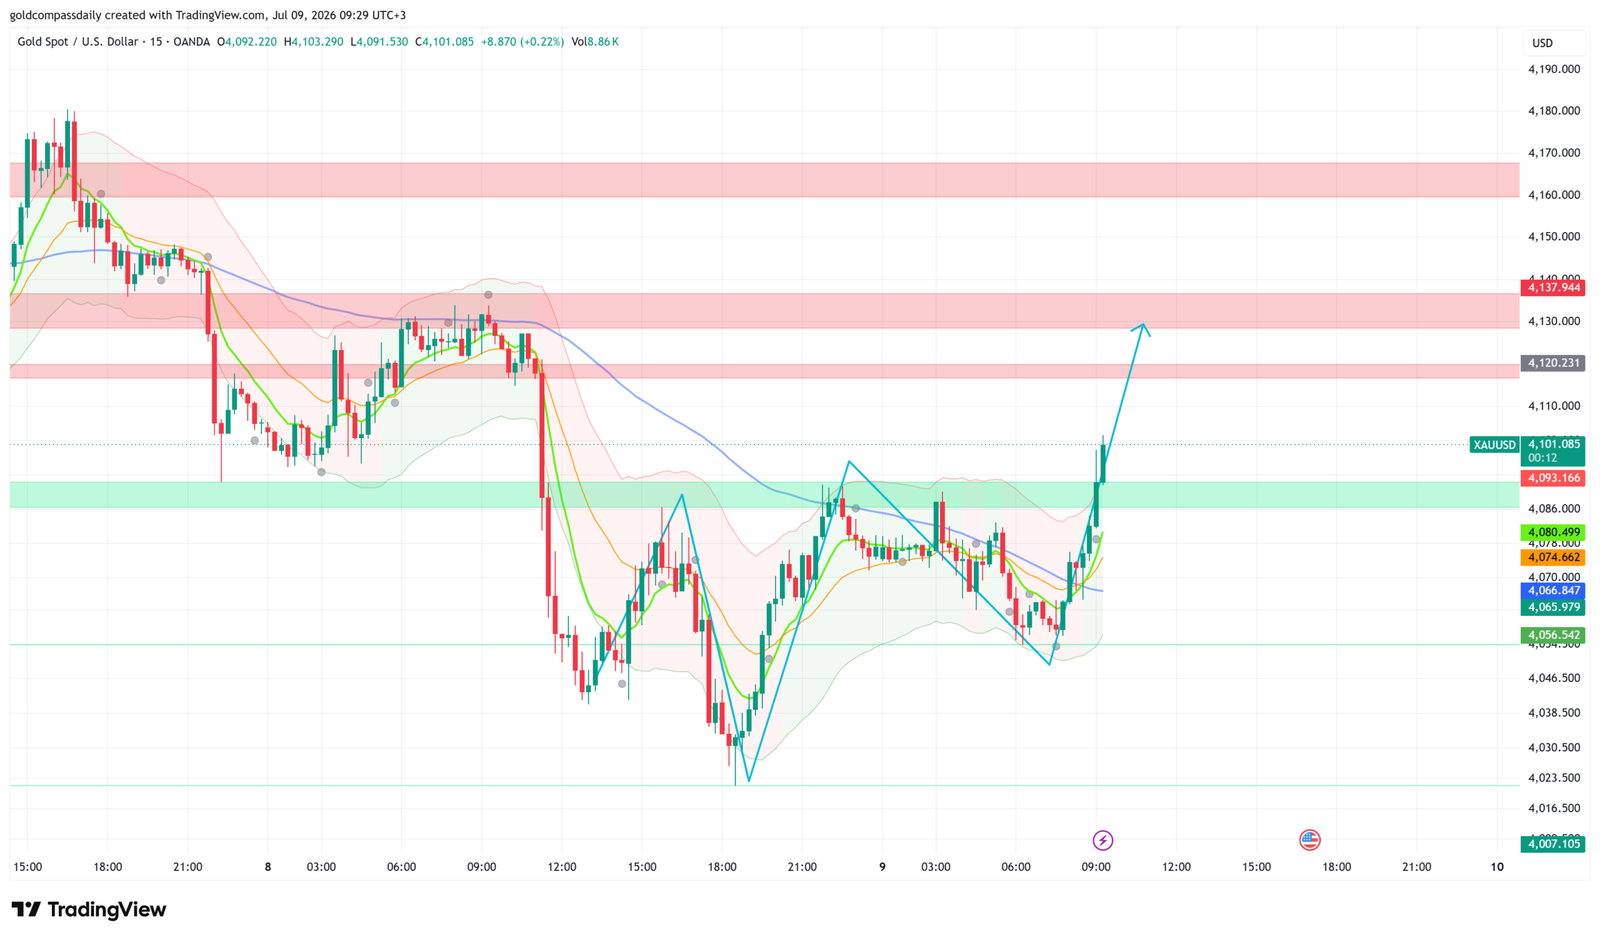
Key Levels
- Bias: Bullish above $4,093
- Support: $4,093 → $4,080 → $4,056
- Resistance: $4,120 → $4,138 → $4,160–$4,170
- Session target: $4,120 (conditional on hold above $4,093 and soft Claims print)
- Invalidation: Below $4,056 — structural demand break, shifts bias neutral-to-bearish
Catalyst of the Day
The primary event driving directional risk for gold today is the US Unemployment Claims release at 3:30pm UTC+3, with the market consensus at 218,000 against a prior reading of 215,000. For gold, the claims print carries dual significance: a softer reading — or an upside surprise — reinforces labour market softening, which historically pressures the Federal Reserve toward a more accommodative posture and weakens the US dollar, both of which are constructive for non-yielding assets. Conversely, a beat below 215,000 would signal labour resilience, reduce rate-cut urgency, and present a headwind for gold’s recovery at current levels. FOMC Member Williams also speaks at 4:00pm UTC+3; any dovish tilt in language would amplify a bullish claims reaction. The 30-year bond auction at 8:01pm UTC+3 rounds out the session — elevated demand (low yield) would reinforce the safe-haven bid and support a close above $4,120.
Fundamental Context
Gold’s sharp intraday selloff from $4,178 to $4,022 on July 8 — followed by an equally aggressive recovery to $4,101 — reflects a market recalibrating after the FOMC Meeting Minutes absorbed most of the directional impulse. The minutes reinforced that the Fed sees no urgency to cut rates in the near term, a marginally hawkish read that explains the initial pressure on gold. However, the subsequent V-shaped rebound signals that the market interpreted the minutes as broadly in line with expectations rather than a hawkish escalation — keeping the medium-term gold bull case structurally intact.
The macro backdrop continues to support gold on dips. Real yields have not moved decisively higher in the wake of the minutes, limiting dollar upside and keeping the opportunity cost of holding gold contained. The ECB Monetary Policy Meeting Accounts release at 2:30pm UTC+3 adds a secondary currency market layer: any language signalling further ECB easing would weaken the euro, pressure EUR/USD, and strengthen the dollar on the margin — a mild headwind for gold that traders should monitor in the lead-up to the Claims print. The net picture is one of a market that sold the headline, bought the dip, and is now waiting for the next US data point to determine whether $4,120–$4,138 is reclaimed before the weekend.
Chart Analysis
The 15-minute chart shows a well-defined V-shaped recovery from the $4,022–$4,025 demand zone reached during Wednesday’s mid-session selloff. Price has since advanced approximately $79 off those lows to print $4,103 as of the time of writing, breaching the $4,093 green demand zone and closing above it — a structurally positive development. The short-term EMA (green) has curled sharply upward and price is trading above it, while the orange medium-term EMA is beginning to flatten after being in downtrend. The longer-term blue EMA remains angled lower near $4,066–$4,070 and represents trailing support rather than overhead pressure. Bollinger Bands have expanded on the advance, with price pushing toward the upper band — suggesting momentum but also proximity to a short-term extension risk. The first resistance cluster at $4,120.231 aligns with a red horizontal band visible on the chart, followed by a denser supply zone between $4,130 and $4,138. The chart’s projected path arrow targets a continuation into that $4,120–$4,140 corridor, contingent on the $4,093 level holding on any pre-data pullback. A clean break and hold above $4,138 opens the $4,160–$4,170 pink supply band as the next meaningful reference.
Bull and Bear Scenarios
Bull Scenario
Trigger: US Unemployment Claims print at or above 218,000 (consensus miss or in-line with prior) and price holds $4,093 on any pre-release dip. Target: $4,120 initial, with extension to $4,138 if Williams’ commentary reinforces a dovish lean. A close above $4,138 on the 15-minute chart shifts the session target to $4,160.
Bear Scenario
Trigger: Claims print materially below 215,000 (labour market strength), dollar accelerates higher, and price fails to hold $4,093 on retests. Target: $4,080 pullback zone, with deeper risk to $4,056 if the $4,080 level gives way intraday. A close below $4,056 on the 15-minute chart invalidates the bullish recovery structure.
Events Ahead
- Thursday 2:30pm UTC+3 — ECB Monetary Policy Meeting Accounts: Insight into the pace of European easing; EUR weakness on dovish accounts would modestly support the dollar and cap gold’s upside pre-Claims.
- Thursday 3:30pm UTC+3 — US Unemployment Claims (forecast 218K, prior 215K): The primary catalyst; softer print weakens dollar and supports gold’s push toward $4,120.
- Thursday 4:00pm UTC+3 — FOMC Member Williams Speaks: Watch for any shift in rate-cut timeline language; dovish signals amplify the Claims-driven gold rally.
- Thursday 5:00pm UTC+3 — US Existing Home Sales (forecast 4.19M, prior 4.17M): Secondary housing data; a miss could reinforce broad US economic softening and extend gold’s bid.
- Thursday 8:01pm UTC+3 — US 30-Year Bond Auction (prior 5.02% / 2.3 bid-to-cover): Strong demand (lower yield) signals safe-haven appetite and would support a late-session gold push above $4,120.
- Friday — End of week positioning and any residual Williams/Fed commentary flow; watch for position squaring into the close that could increase volatility across the $4,100–$4,138 range.
For broader macro context heading into this week’s data flow, see the Gold Week Ahead: July 6–10 hub. For Wednesday’s full session analysis covering the FOMC Minutes reaction and the $4,022 low, see XAU/USD Consolidates at $4,130 Ahead of FOMC Minutes — Bulls Eye $4,182.
New York Session Update
Price Check
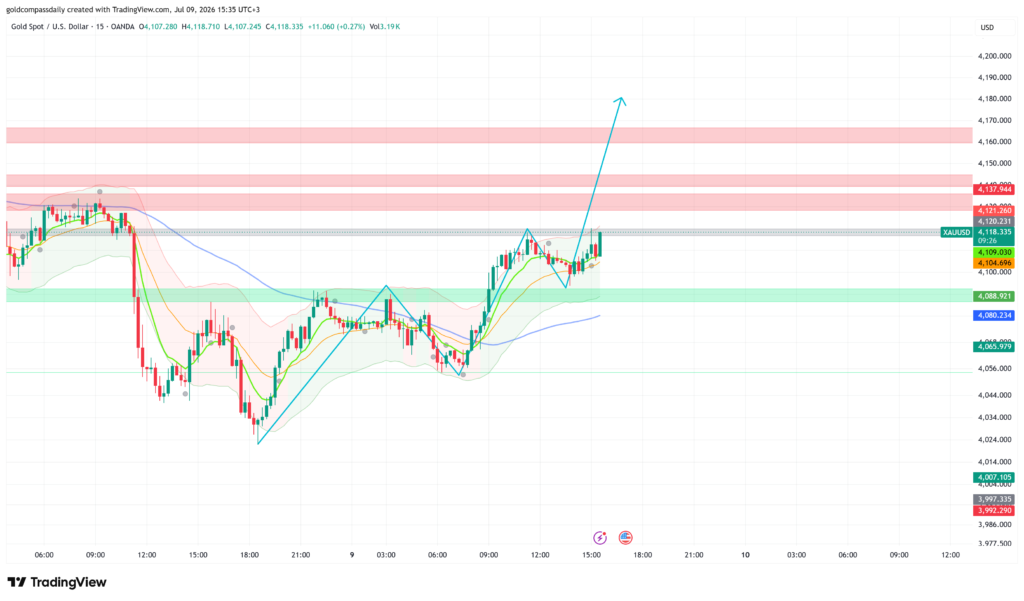
Gold has advanced to $4,118 as of 15:35 UTC+3, pressing directly into the $4,120–$4,121 resistance cluster identified in the morning analysis. The morning buy bias has held without a meaningful retest of the $4,093 support level, with price grinding higher through the European session and accelerating into the New York open.
What Changed
US Unemployment Claims printed at 218,000, in line with the consensus forecast and marginally above the prior 215,000 reading — the softer labour signal Gold Compass Daily’s morning analysis flagged as the primary bull catalyst. The data reinforced the view that the Federal Reserve faces no urgency to tighten further, keeping real yield pressure contained and supporting gold’s bid into the afternoon session. Price responded with a measured continuation rally rather than a sharp spike, suggesting the Claims print was largely priced into the morning recovery and that the market is now recalibrating around the next trigger: FOMC Member Williams at 4:00pm UTC+3 and the 30-year bond auction at 8:01pm UTC+3.
Updated Levels
- Current price: $4,118
- Bias now: Bullish — unchanged; morning thesis intact, now pressing first major resistance
- Updated support: $4,109 → $4,089 (green demand zone) → $4,080
- Updated resistance: $4,120–$4,121 (immediate cluster) → $4,138 → $4,160–$4,170
- NY session target: $4,138 on a confirmed close above $4,121; $4,160 if Williams delivers dovish language
Scenarios Into the Close
Bull: Price closes a 15-minute candle above $4,121 with follow-through volume — target $4,138 initially, with extension to $4,160 contingent on Williams’ commentary and strong 30-year bond auction demand. Bear: Rejection at $4,120–$4,121 and a break back below $4,109 signals near-term exhaustion — retracement to the $4,089 green demand zone before any renewed attempt higher.
Chart Analysis
The 15-minute chart as of 15:35 UTC+3 shows price pressing into a tightly stacked resistance cluster at $4,120.231 and $4,121.260 — the same zone the morning analysis identified as the first structural hurdle. The advance from the $4,022 V-shaped low has been orderly, with a brief consolidation between $4,088 and $4,100 through the overnight session before a clean breakout through $4,109 into the New York open. The short-term green EMA is sharply angled upward and price is trading above it; the orange medium-term EMA has flattened and is being reclaimed from below; the longer-term blue EMA has begun to curl upward beneath price near $4,080, indicating a full bullish EMA re-stack is forming. Bollinger Bands are expanding to the upside, consistent with a trend acceleration phase rather than a range. The chart’s projected path arrow points toward $4,160–$4,180, with $4,138 serving as the key intermediate gate. A clean 15-minute close above $4,121 would mark the first confirmed break of meaningful supply since Wednesday’s selloff and open that $4,138–$4,160 corridor for the remainder of the New York session.
Analysis based on the XAU/USD 15-minute chart as of July 9, 2026, 09:29 UTC+3. This article is for informational and educational purposes only and does not constitute financial advice.