

Gold trades neutral to cautiously bullish at $4,028, pinned to a critical support cluster as the market awaits high-impact US Retail Sales and Unemployment Claims data at 15:30 UTC+3 — the session’s definitive price-discovery event. Following Tuesday’s sharp rejection from $4,080 and Wednesday’s consolidation around the $4,028–$4,045 range, the metal is defending a key structural floor with declining volume, leaving directional resolution to the afternoon data releases.
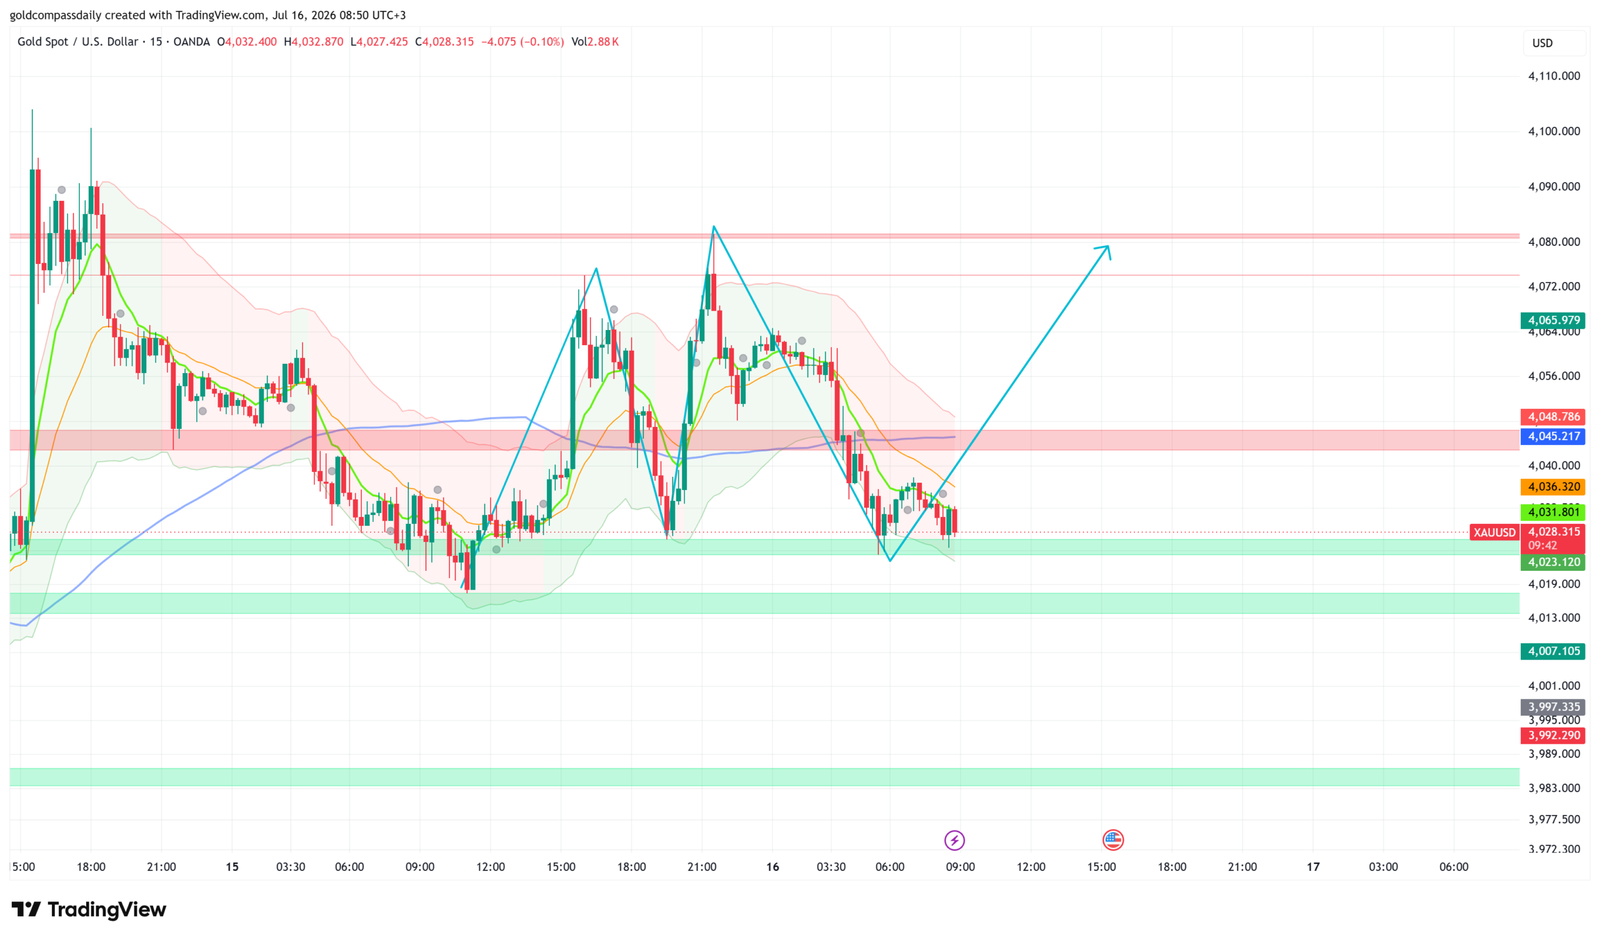
Key Levels
- Bias: Neutral — hold above $4,023; directional bias reassessed on confirmed break
- Support: $4,023 → $4,007
- Resistance: $4,045–$4,049 (pink band) → $4,065 → $4,080
- Session bull target: $4,065 (conditional on Retail Sales miss and USD weakness)
- Session bear target: $4,007 (conditional on Retail Sales beat and sustained break below $4,023)
- Invalidation: Below $4,007 = structural support failure; opens path toward $3,992–$3,997
Catalyst of the Day
The primary catalyst for Thursday’s New York session is the simultaneous release of US Core Retail Sales, Retail Sales, and Unemployment Claims at 15:30 UTC+3. A strong Retail Sales print — forecast at 0.2% headline versus 0.9% prior — would reinforce the narrative of a resilient consumer, reducing pressure on the Federal Reserve to cut rates and strengthening the US dollar at gold’s direct expense. Conversely, a miss on Retail Sales alongside elevated claims would reignite rate-cut expectations, providing the macro fuel for a recovery toward $4,065. With Retail Sales having delivered a 0.9% surprise in June, the bar for a repeat beat is high — but gold is currently positioned at structural support with no cushion to absorb a USD spike. Time to watch: 15:30 UTC+3. The first 15-minute candle post-release establishes the session’s directional bias.
Fundamental Context
Wednesday’s session left gold in a structurally weakened position. The metal failed to sustain the recovery above $4,065 following Fed Chair Kevin Warsh’s Congressional testimony and Tuesday’s CPI data, both of which delivered fewer rate-cut signals than the market had priced in. Warsh’s emphasis on data-dependency rather than a pre-committed easing path reinforced the message that the Fed is not in a hurry to move — a headwind for a non-yielding asset. Gold Compass Daily’s Wednesday analysis outlined the $4,028 level as the line in the sand, and price has effectively stalled there into the Asian and European sessions, respecting the zone with no directional resolution.
The broader macro picture for gold remains a study in competing forces. Dollar Index stability and the absence of fresh geopolitical escalation have removed two of gold’s primary near-term tailwinds, while real yields remain at levels that historically cap sustained upside. On the constructive side, central bank demand and structural de-dollarisation flows continue to provide a floor beneath spot prices — a reason why the $4,007–$4,023 band has repeatedly absorbed selling pressure over the past week. Thursday’s data slate, including the Philly Fed Manufacturing Index (forecast 12.7 versus 10.3 prior) and Business Inventories, rounds out the macro picture but remains secondary to the Retail Sales print. For full context on the week’s macro framework, including the CPI and Warsh outcomes, see the July 13–17 Weekly Hub.
Chart Analysis
The 15-minute XAU/USD chart as of 08:50 UTC+3 shows a clear downtrend from the July 15 session high near $4,080, with price printing a sequence of lower highs and lower lows into the $4,027–$4,031 area. Moving averages are in bearish alignment — the short-period green MA sits below the medium yellow/orange MA, which in turn sits below the longer blue MA — confirming the intraday momentum bias remains negative. Price is presently testing the upper boundary of the $4,023–$4,028 green support cluster visible at the base of the chart, corresponding precisely to the key structural support identified in Wednesday’s analysis. The annotated blue projection on the chart traces a potential test of $4,007 followed by a recovery toward $4,080, consistent with the bull scenario conditional on afternoon data. The $4,045–$4,049 pink resistance band presents the first meaningful obstacle on any recovery attempt. A reclaim of $4,045 with a 15-minute close would shift the short-term structure from bearish to neutral. The $4,023 level marks the concrete breakdown threshold — a sustained close below it opens $4,007 as the next structural target.
Bull / Bear Scenarios
Bull Scenario
Trigger: US Retail Sales misses forecast (headline below 0.0%) and/or Unemployment Claims print above 220K → USD weakens → Gold reclaims $4,045 on a 15-minute close → Target: $4,065, extension to $4,080
Bear Scenario
Trigger: US Retail Sales beats forecast (headline above 0.4%) → USD strengthens → Gold breaks and closes a 15-minute candle below $4,023 → Target: $4,007, extension to $3,992
Events Ahead
- Thursday 15:30 UTC+3 — US Retail Sales m/m (forecast 0.2%) and Core Retail Sales m/m (forecast 0.0%): The session’s defining event; a beat strengthens USD and pressures gold, a miss fuels rate-cut expectations and supports a recovery.
- Thursday 15:30 UTC+3 — US Unemployment Claims (forecast 216K): Elevated claims above 220K would amplify any Retail Sales softness, compounding USD weakness.
- Thursday 15:30 UTC+3 — Philly Fed Manufacturing Index (forecast 12.7): Secondary data; a sharp miss could add marginal support to gold via growth-concern narrative.
- Thursday 17:00 UTC+3 — US Pending Home Sales m/m (forecast -0.5%) and NAHB Housing Market Index (35): Secondary; housing weakness adds modest macro-risk support but unlikely to move gold independently.
- Thursday 19:30 UTC+3 — FOMC Member Logan Speaks: Watch for any deviation from the Fed’s current data-dependent, no-rush tone; hawkish commentary would be negative for gold.
- Thursday 20:25 UTC+3 — FOMC Member Schmid Speaks: Same as Logan — tone consistency across Fed speakers is a factor in market confidence around rate expectations.
- Friday — Week closes; no major US data expected. Position squaring into the weekend may add volatility to any Thursday directional move.
New York Session Update
Gold has broken decisively below every support level identified in the morning analysis, with price at $3,993.94 at time of update — the bear scenario has executed with full force. The morning’s $4,023 invalidation threshold was cleared within minutes of the 15:30 UTC+3 data release, with the subsequent sell-off extending a further $30 to the current session low of $3,990.58.
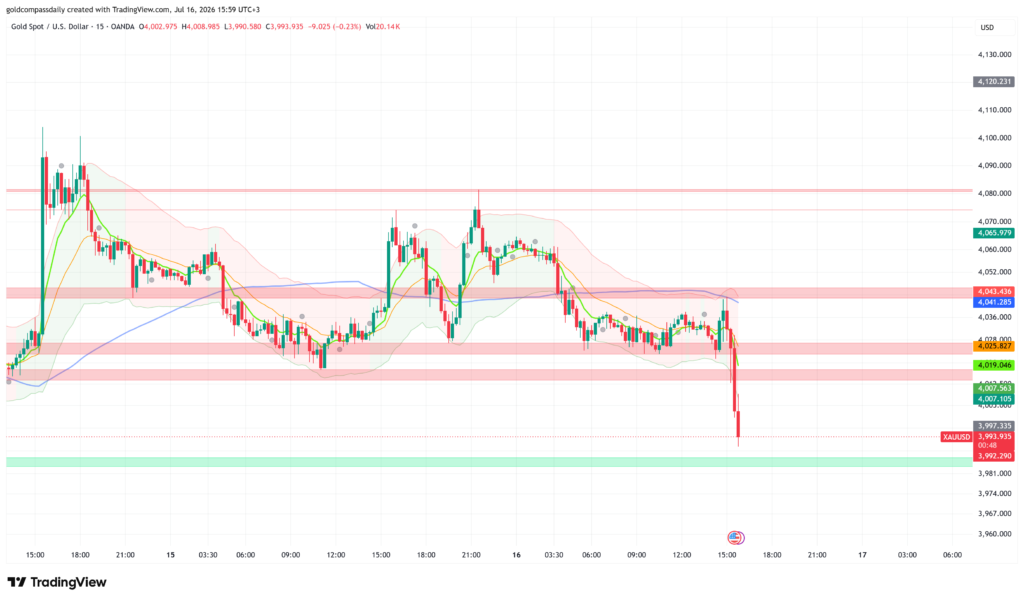
The driver was a stronger-than-expected US Retail Sales print at 15:30 UTC+3. The headline figure significantly exceeded the 0.2% consensus forecast, eliminating the near-term case for Federal Reserve rate cuts and triggering a sharp US dollar rally. Gold, which entered the New York session at $4,028 with no support buffer below $4,023, absorbed the full force of the USD move. The breakdown cascaded through $4,019, $4,007, and $3,997 in succession — all levels the morning analysis identified as the bear path’s waypoints. Price is now attempting to stabilise just above the $3,992.29 structural floor visible on the chart, with a session low of $3,990.58 representing the deepest print of the day. The post-data partial bounce has been shallow, with the metal unable to reclaim even the $3,997 area, indicating sellers remain in control.
Updated Levels
- Current price: $3,993.94 (session low: $3,990.58)
- Bias now: Bearish — all morning support levels violated; structure fully inverted
- Updated support: $3,992.29 (chart floor, immediate) → $3,981–$3,989 (wide green band)
- Updated resistance: $3,997.34 → $4,007.10–$4,007.56 (flipped former support) → $4,019.05 → $4,025.83
- NY session target: $3,981–$3,989 band on continued pressure; $4,007 on recovery
Scenarios into the Close
Bull: Price holds $3,992.29 and reclaims $3,997.34 on a 15-minute close → initial recovery toward $4,007.10, with $4,019 as the upper bound of any bounce into the close.
Bear: Sustained failure to hold $3,992.29 and a close below $3,990 → extension into the $3,981–$3,989 structural band, with limited chart support visible below that level until $3,972.
Chart Analysis
The 15-minute chart as of 15:59 UTC+3 shows a near-vertical collapse candle at the 15:00 bar, confirming the data-event sell-off structure. The session high of $4,008.99 was set before the release; the low of $3,990.58 was set immediately after. Price is currently at $3,993.94, marginally above the $3,992.29 green support label — the last clearly defined structural floor before the wide $3,981–$3,989 band that represents the base of the chart. All three moving averages — short green, medium yellow/orange, and long blue — are stacked far above price with no sign of compression, confirming there is no near-term MA support. The blue MA sits at $4,041.29, the purple at $4,041.29, placing them roughly $47 above current price and underscoring the severity of the intraday structural break. The $4,007.10–$4,007.56 double label on the chart’s right side — formerly a key support zone flagged in the morning analysis — now functions as the primary resistance on any recovery attempt. A 15-minute close above that cluster is the minimum requirement to suggest stabilisation; without it, the bias into the Friday open remains firmly bearish.
End Session Update
Price Check
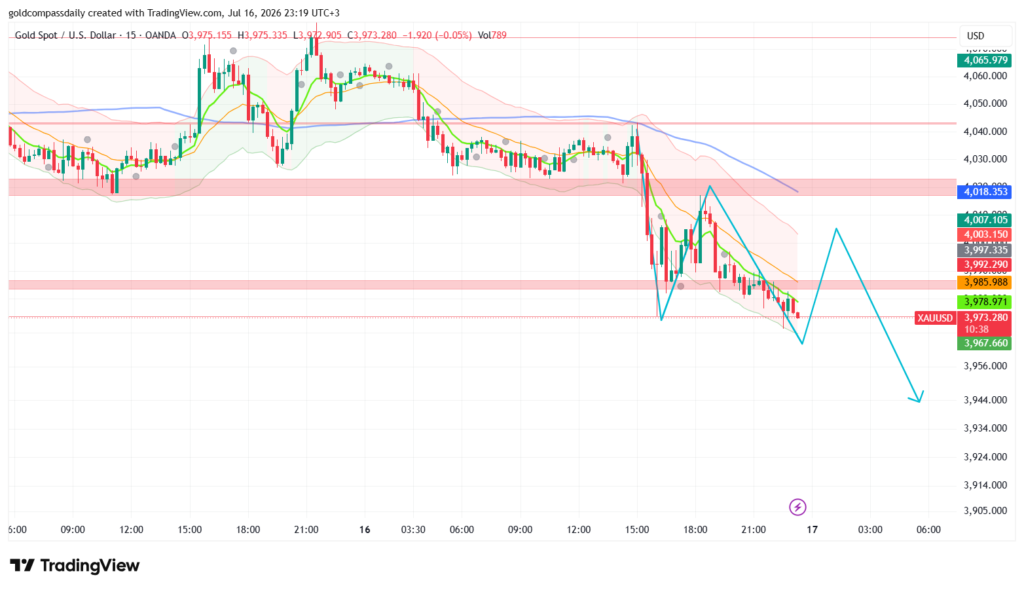
Gold is trading at $3,973.28 at the time of this update, marking a dramatic breakdown from the morning’s $4,028 holding level. The morning bias of neutral-to-cautiously bullish has failed conclusively, with price now trading $55 lower and below every identified support threshold.
What Changed
The catalyst was the US Retail Sales and Unemployment Claims data released at 15:30 UTC+3, which delivered a much stronger-than-expected headline print relative to the 0.2% consensus forecast. This eliminated the near-term case for Federal Reserve rate cuts and triggered a sharp US dollar rally that overwhelmed gold’s structural defenses. The breakdown cascaded through $4,023, $4,007, and $3,997 in rapid succession during the New York session, with the full force of the USD move exposing the metal’s vulnerability after Tuesday’s rejection from $4,080. A session low of $3,967.66 was recorded, representing a full $60 decline from the morning’s holding pattern.
Updated Levels
- Current price: $3,973.28
- Bias now: Bearish — all morning support levels violated; structure fully inverted with price below all MAs
- Updated support: $3,967.66 (session low) → $3,956–$3,944 (next structural band visible on chart)
- Updated resistance: $3,978.97 → $3,985.99 → $3,992.29 (flipped former support) → $4,007.10
- Tomorrow sessions target: $3,956 on continued pressure; $3,992 on corrective bounce
Scenarios into the Close
Bull: Price holds above $3,972.90 and reclaims $3,978.97 on a 15-minute close → initial recovery toward $3,985.99, with $3,992.29 as the ceiling for any late-session bounce.
Bear: Failure to hold $3,972.90 and a close below $3,967.66 → extension toward the $3,956–$3,944 band, with limited chart support visible until the $3,934 area.
Chart Analysis
The 15-minute XAU/USD chart as of 19:19 UTC+3 reveals a session defined by a catastrophic breakdown structure that has completely inverted the morning’s technical setup. Price collapsed from the $4,028 holding level through consecutive support floors at $4,023, $4,007, and $3,997 within minutes of the data release, with the sell-off extending to a session low of $3,967.66. The current price of $3,973.28 sits marginally above the session low, with the 10:38 candle marking the initial breakdown candle that established the bearish structure. All three moving averages — short-period green, medium yellow/orange, and long blue — are stacked well above price with no signs of compression, confirming the absence of near-term MA support. The green short MA sits near $3,985.99, the blue MA near $4,018.35, and the yellow MA near $4,007.10, with all three now functioning as resistance clusters rather than support. The chart’s $4,018.35 and $4,007.10 labels on the right side — formerly key support zones from the morning analysis — now represent the primary resistance barrier on any recovery attempt. The $3,978.97 level serves as immediate overhead resistance, with a 15-minute close above this level required to suggest even a temporary stabilisation. The $3,972.90 level marks the current session floor; a sustained break below this opens the $3,956–$3,944 band as the next structural target. The absence of any significant bullish reversal candles or volume spikes indicates sellers remain firmly in control, with the potential for further downside into the Friday Asian session if $3,972.90 fails to hold.
Analysis based on the XAU/USD 15-minute chart as of July 16, 2026, 08:50 UTC+3. This article is for informational and educational purposes only and does not constitute financial advice.