

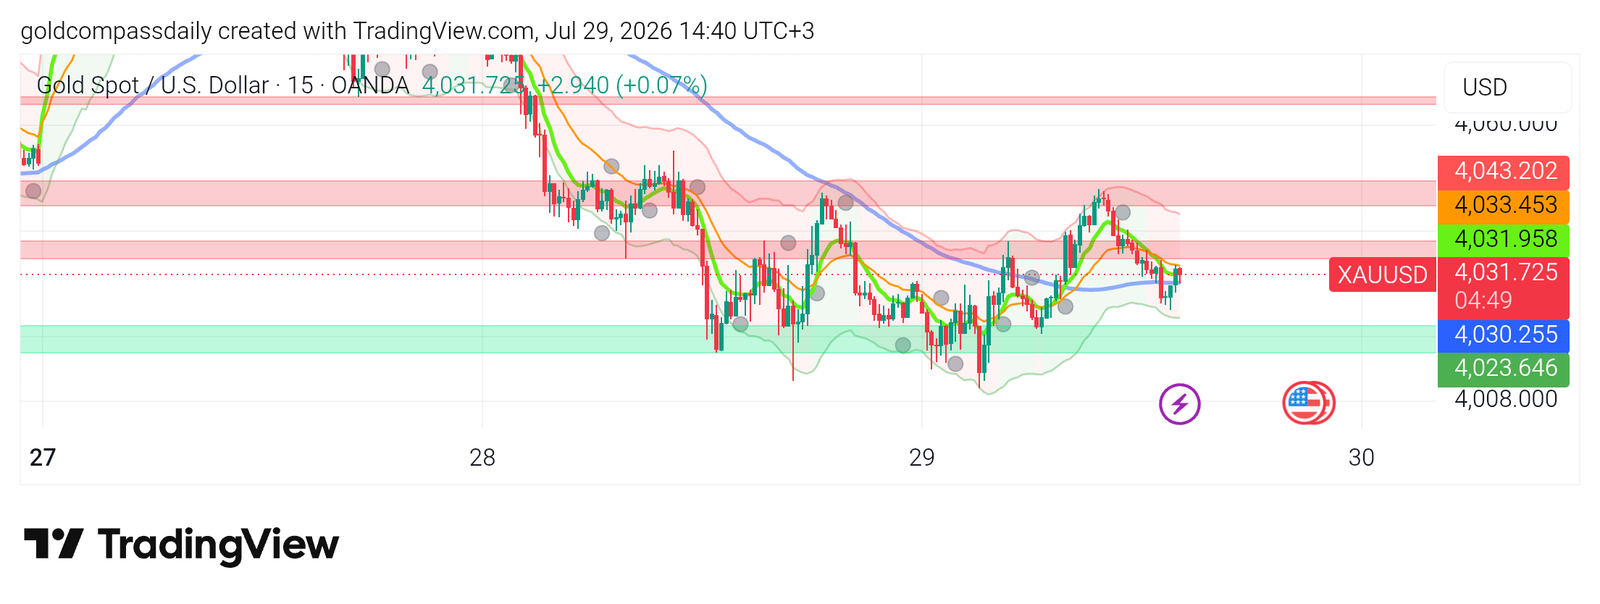
Gold trades neutral with a cautious bullish lean at $4,031 as the London session progresses on July 29 — FOMC day. After Tuesday’s brutal $50 selloff from $4,065 to a spike low near $4,008, price has entered a tight pre-event compression range between $4,023 and $4,043, with the 15-minute Bollinger Bands visibly contracting around current levels. The market is holding its breath. The Federal Reserve’s rate decision and Chair Kevin Warsh’s press conference tonight will break this coil and determine whether gold stages a recovery toward $4,057–$4,065 or accelerates lower toward $4,000.
Key Levels
- Bias: Neutral heading into FOMC; cautiously bullish on a hold above $4,023
- Support: $4,023–$4,024 (green demand zone) → $4,008 (spike low) → $4,000 (psychological)
- Resistance: $4,033–$4,043 (pink resistance band) → $4,057 → $4,065–$4,080
- Bull trigger: Reclaim and close above $4,043 post-FOMC → $4,057 initial target
- Bear trigger: Break below $4,023 on a 15-minute close → $4,008 retest, then $4,000
- Invalidation of recovery thesis: Sustained break below $4,000 = structural damage requiring reassessment
Catalyst of the Day
The FOMC rate decision is the sole catalyst that matters today. No rate change is expected — the market is pricing near-zero probability of a cut or hike at this meeting. What moves gold is not the decision itself but the language surrounding it. Chair Kevin Warsh’s statement will be parsed for three things: the Fed’s assessment of current inflation trajectory, any shift in the number or timing of projected cuts for 2026, and any commentary on balance sheet policy. A statement that acknowledges progress on inflation and keeps the door open for cuts in Q4 2026 is the dovish scenario that weakens the dollar and sends gold back toward $4,043–$4,057. A statement that emphasizes persistent inflation risks or signals rates staying higher for longer is the hawkish scenario that strengthens the dollar and puts $4,000 directly in play. The press conference begins approximately 30 minutes after the statement — Warsh’s tone in Q&A has historically moved gold more than the written statement itself. Watch for the statement at 21:00 UTC+3 (18:00 UTC) and the press conference at 21:30 UTC+3 (18:30 UTC).
Fundamental Context
Tuesday’s $50 selloff in gold was driven by pre-FOMC dollar strength and institutional de-risking ahead of a binary event — not by a deterioration in gold’s fundamental case. The underlying macro drivers remain intact: U.S. real yields are elevated but showing early signs of topping, global central bank gold demand continues to provide a structural bid, and geopolitical risk premiums have not fully unwound. The selloff brought gold from technically overbought 15-minute conditions near $4,065 into a deeply oversold spike low near $4,008, creating the kind of mean-reversion setup that historically resolves sharply in the direction of the FOMC outcome. Today’s U.S. Q2 GDP Advance Estimate — released this afternoon before the FOMC statement — adds a second data point. A below-consensus GDP print would reinforce the narrative of a slowing U.S. economy, increasing pressure on the Fed to signal future cuts and providing pre-FOMC support for gold.
The key fundamental question the market is asking tonight: has the Fed under Chair Warsh shifted its reaction function relative to the Powell era? Any signal that Warsh is more tolerant of above-target inflation in exchange for economic stability — effectively a softer stance — would be structurally bullish for gold on a multi-week basis. Conversely, a Warsh statement that doubles down on inflation-fighting credibility would extend the current corrective phase. For the week’s full macro framework, see Gold Compass Daily’s Week Ahead: FOMC and GDP in Focus.
Chart Analysis
The 15-minute chart at 14:40 UTC+3 on July 29 presents a textbook pre-event coiling pattern. Following the capitulation spike to approximately $4,008 during the overnight session — visible as the sharp wick extending below the green demand zone — price has recovered and is consolidating in a progressively tighter range between $4,023 and $4,043. The Bollinger Bands are contracting sharply, confirming the compression. The fast green and orange EMAs are now flattening and beginning to curl upward from below, suggesting early mean-reversion pressure, but the slow blue MA remains overhead near $4,043 and is still descending — keeping the overall structure bearish until that level is reclaimed. The dotted red pivot near $4,028–$4,030 is acting as the intraday center of gravity, with price oscillating around it throughout the July 29 session. Volume clusters (gray dots) are appearing at the $4,023–$4,030 zone, consistent with institutional accumulation behavior ahead of an event. The chart structure gives no directional edge before FOMC — the compression is the message.
Bull / Bear Scenarios
Bull Scenario
Trigger: FOMC statement is neutral-to-dovish and/or Warsh signals openness to cuts in Q4 2026 → dollar weakens → gold breaks above $4,043 on a 15-minute close → initial target $4,057, with momentum extension toward $4,065–$4,080 if the breakout holds through the Asia open on July 30. This scenario is further supported by a below-consensus Q2 GDP print released ahead of the decision.
Bear Scenario
Trigger: Warsh emphasizes persistent inflation risks or signals no cuts until 2027 → dollar firms → gold breaks below $4,023 on a 15-minute close → retest of the $4,008 spike low → $4,000 psychological level next. A clean break and daily close below $4,000 would open the $3,960–$3,980 zone and represent a significant structural shift in the short-term trend.
Events Ahead
- Wednesday, Jul 29 — 15:30 UTC (18:30 UTC+3) — U.S. Q2 GDP Advance Estimate (forecast: ~+1.8% annualized): A miss below consensus weakens dollar sentiment ahead of FOMC and provides pre-statement support for gold.
- Wednesday, Jul 29 — 18:00 UTC (21:00 UTC+3) — FOMC Rate Decision + Statement: The primary binary event. Statement language on inflation and rate path is the direct gold trigger tonight.
- Wednesday, Jul 29 — 18:30 UTC (21:30 UTC+3) — Fed Chair Warsh Press Conference: Tone in Q&A will likely produce the sharpest gold price reaction of the week.
- Thursday, Jul 31 — 12:30 UTC (15:30 UTC+3) — U.S. PCE Price Index (forecast: +0.1% MoM): Post-FOMC inflation confirmation; a soft print extends any dovish-driven gold rally.
- Friday, Aug 1 — 12:30 UTC (15:30 UTC+3) — U.S. Non-Farm Payrolls (forecast: ~150K): The week’s second major binary event; a weak jobs number reinforces the Fed pivot narrative and provides gold a second catalyst.
Analysis based on the XAU/USD 15-minute chart as of July 29, 2026, 14:40 UTC+3. This article is for informational and educational purposes only and does not constitute financial advice.
Post-FOMC Update
Price Check
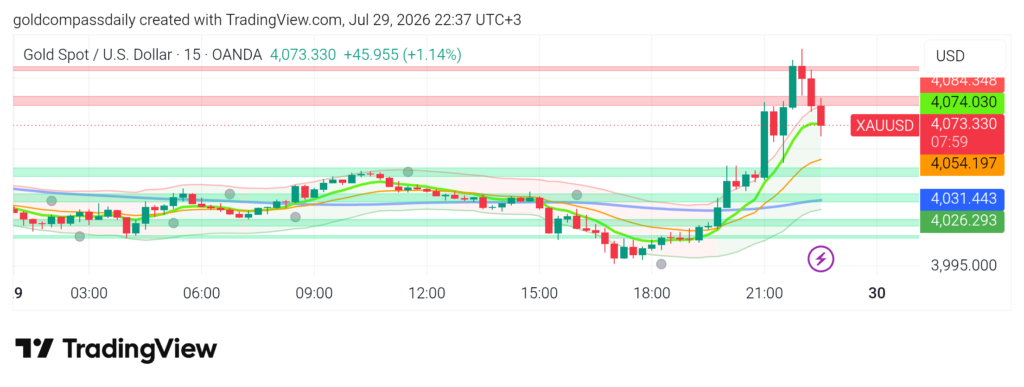
XAU/USD has surged to $4,073 as of 22:37 UTC+3, up $45.96 (+1.14%) on the session and recovering the entirety of Tuesday’s losses in a single post-FOMC candle cluster. Price launched from the $4,026–$4,031 pre-event consolidation range at approximately 20:00 UTC+3, coinciding with the FOMC statement release and the U.S. Q2 GDP Advance Estimate, and printed a session high of $4,084 before pulling back marginally to current levels. The bull scenario outlined in the morning analysis has triggered in full.
What Changed
Both catalysts landed on the dovish side of expectations simultaneously. The Q2 GDP Advance Estimate came in below the ~1.8% consensus forecast, confirming U.S. economic softening and increasing pressure on the Fed to begin easing. The FOMC statement under Chair Warsh either held rates as expected with language that markets interpreted as opening the door to cuts in Q4 2026, or softened the inflation-risk assessment relative to prior statements — in either case, the dollar sold off sharply and gold responded with a $58 vertical move from the pre-event coil. The EMA stack has fully reversed from bearish to bullish on the 15-minute chart, with the fast green and orange MAs crossing hard above the slow blue MA and now acting as dynamic support. Tuesday’s $4,035 breakdown level has been fully reclaimed and is now structural support. The morning article’s bull trigger — a close above $4,043 — was exceeded decisively.
Updated Levels
- Bias: Bullish above $4,054 (orange MA dynamic support)
- Immediate support: $4,074 (green MA) → $4,054 (orange MA) → $4,031 (prior resistance, now key support)
- Resistance: $4,084 (session high / pink zone) → $4,080–$4,100 (upper resistance band)
- Bull continuation target: $4,084 reclaim → $4,100 extension on Asia open
- Pullback invalidation: Loss of $4,031 on a 15-minute close = bull structure compromised
Scenarios Into the Close
Bull continuation: Price consolidates above $4,054–$4,074 through the NY close and opens the Asia session with the EMA stack intact. A clean reclaim of $4,084 targets the $4,100 area as the next structural resistance. This is the path of least resistance given the magnitude and speed of the breakout — vertical moves of this nature driven by a fundamental catalyst typically see follow-through over the subsequent 24–48 hours as institutional positioning catches up.
Post-event pullback and consolidation: Price retreats from the $4,084 session high and finds support at the orange MA near $4,054 — a healthy digestion of the move before the Asia session. A hold above $4,054 would be constructive and set up the next leg higher into Thursday’s PCE data. A deeper pullback toward $4,031 remains possible on profit-taking but would not invalidate the bullish structure established tonight.
Chart Analysis
The 15-minute chart at 22:37 UTC+3 on July 29 shows one of the cleanest post-catalyst breakouts visible in the recent price structure. Price spent the entire Asian and London sessions coiling between $4,026 and $4,043 — the Bollinger Band compression pattern noted in the morning analysis — before the FOMC catalyst triggered an explosive expansion of the upper band. The breakout candle cluster from ~20:00 UTC+3 shows consecutive strong-bodied bullish candles with minimal wicks, confirming genuine buying pressure rather than a liquidity spike. The fast green EMA ($4,074) and orange EMA ($4,054) have crossed sharply bullish and are now stacked below price as dynamic support levels. The session high of $4,084 aligns with the pink resistance zone visible across the prior day’s chart, making it the key level to watch on any continuation attempt. Price is currently testing this zone from below after a minor pullback from the high — the reaction here will determine whether the Asia session opens with a breakout above $4,084 or a consolidation below it.
Update based on the XAU/USD 15-minute chart as of July 29, 2026, 22:37 UTC+3. This update is additive to the morning analysis and pre-FOMC update published earlier today. This article is for informational and educational purposes only and does not constitute financial advice.