

Gold trades bullish at $4,077 as the London session progresses on July 30, consolidating Wednesday night’s FOMC-driven surge from $4,026 to a spike high near $4,095. The post-breakout structure is constructive: price pulled back to the $4,046–$4,055 demand zone during the Asia session, found buyers, and has recovered toward the $4,077–$4,085 resistance cluster as London trade develops. The EMA stack is re-establishing bullishly below price, and $4,100 — the major resistance level — is now the session target if today’s PCE inflation data confirms the dovish narrative that triggered Wednesday’s rally. The bull bias established after the FOMC remains intact above $4,065.
Gold trades bullish at $4,077 as the London session progresses on July 30, consolidating Wednesday night’s FOMC-driven surge from $4,026 to a spike high near $4,095. The post-breakout structure is constructive: price pulled back to the $4,046–$4,055 demand zone during the Asia session, found buyers, and has recovered toward the $4,077–$4,085 resistance cluster as London trade develops. The EMA stack is re-establishing bullishly below price, and $4,100 — the major resistance level — is now the session target if today’s PCE inflation data confirms the dovish narrative that triggered Wednesday’s rally. The bull bias established after the FOMC remains intact above $4,065.
Key Levels
- Bias: Bullish above $4,065 (orange MA dynamic support)
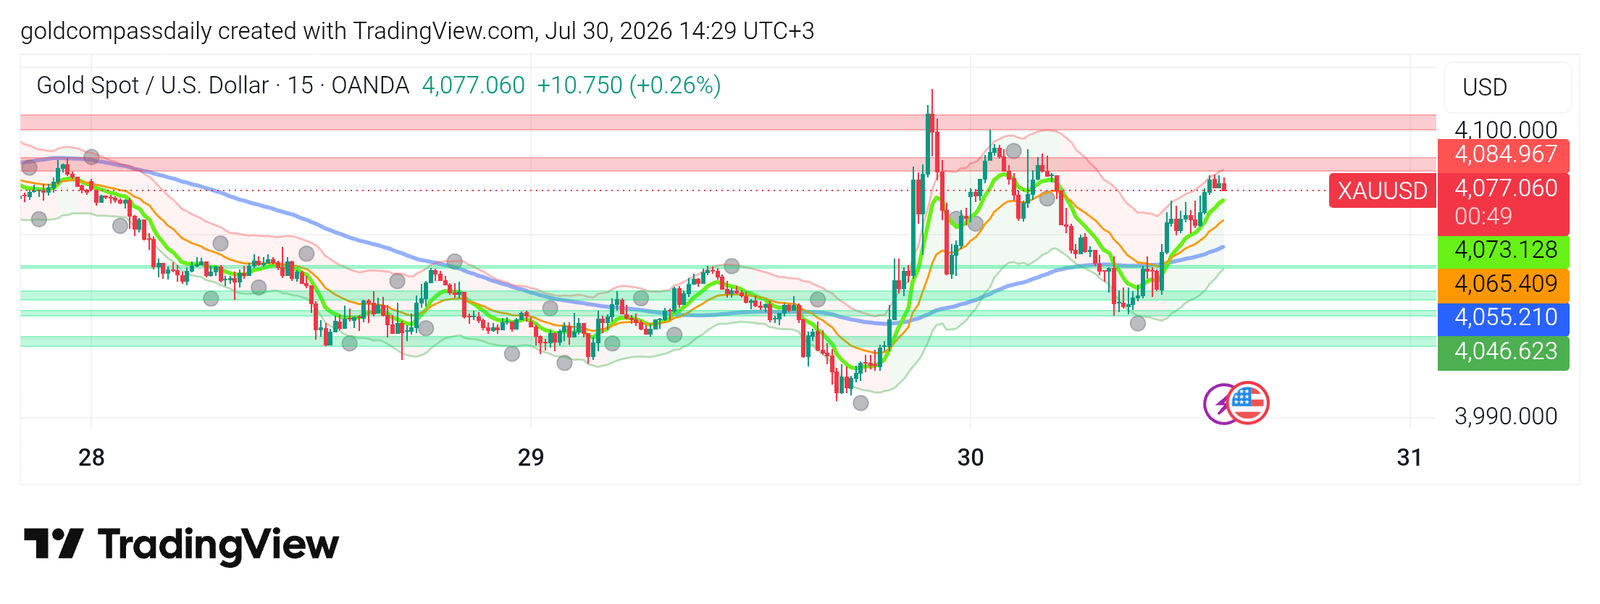
- Support: $4,073 (green MA) → $4,065 (orange MA) → $4,055 → $4,046 (green demand zone)
- Resistance: $4,084–$4,085 (prior spike high) → $4,100 (major resistance / upper pink zone)
- Session target: $4,100 (conditional on PCE soft print and $4,085 reclaim)
- Invalidation: Break and close below $4,046 = post-FOMC bull structure compromised; reassess toward $4,026
Catalyst of the Day
The U.S. PCE Price Index — the Federal Reserve’s preferred inflation gauge — is the single catalyst driving gold’s price action today. Released at 15:30 UTC (18:30 UTC+3), PCE is the first major inflation print in the post-FOMC environment and will either validate or challenge the dovish interpretation of Wednesday’s statement. A soft PCE reading — at or below the +0.1% MoM forecast — confirms that inflation is cooling toward target, vindicates any dovish tilt in Warsh’s language, and gives gold the fundamental fuel to break above $4,085 and test $4,100. A hot PCE print — above +0.2% MoM — would force markets to reassess the rate cut timeline, strengthen the dollar, and put immediate pressure on the $4,065 support. Today’s PCE is not a secondary event: it is the data point that prices the FOMC’s next move, making it a direct real-yield and dollar driver for gold.
Fundamental Context
Wednesday’s FOMC-driven $46 surge confirmed that gold’s fundamental bid remains intact. The market’s reaction to Warsh’s statement — selling the dollar and buying gold aggressively — signals that institutional positioning has shifted back toward risk-off safe-haven accumulation after the pre-FOMC flush. The Q2 GDP miss that accompanied the FOMC added a second layer: a slowing economy increases the probability of cuts, reducing real yields and lowering the dollar’s relative yield advantage over gold. The combination of a softer growth picture and a Fed that is at minimum not turning hawkish is the macro backdrop gold needs to sustain prices above $4,065 and push toward new highs.
The PCE print today completes the picture. If inflation is cooling while growth is slowing, the Fed’s window for cuts opens materially — and gold prices that window in advance. Gold Compass Daily notes that the current price action closely mirrors the pattern seen in prior Fed pivot cycles: a sharp pre-decision selloff driven by institutional hedging, a violent reversal on dovish confirmation, and then a consolidation phase before the next leg higher as broader market participants reprice the rate outlook. Friday’s Non-Farm Payrolls on August 1 will be the next test of that thesis. For the full week’s macro framework, see Gold Compass Daily’s Week Ahead: FOMC and GDP in Focus.
Chart Analysis
The 15-minute chart at 14:29 UTC+3 on July 30 shows a classic post-breakout consolidation structure. The three-day price history is fully visible: the July 28 selloff from $4,065 to $4,008, the July 29 pre-FOMC base between $4,026 and $4,043, the explosive FOMC breakout to a spike high near $4,095, and the current consolidation phase. The Asia session on July 30 pulled back to the $4,046–$4,055 green demand zone — a healthy retest of prior resistance now acting as support — before buyers stepped back in. Price is now recovering toward $4,077–$4,085, with the green EMA at $4,073 and orange EMA at $4,065 both below price and curling upward in a re-establishing bullish stack. The Bollinger Bands have re-expanded from Wednesday’s spike and price is currently in mid-band territory, suggesting the move is not technically overbought on the 15-minute timeframe. The $4,084–$4,085 zone is the immediate resistance to watch — it aligns with the post-FOMC spike high and represents the level bulls must reclaim on a 15-minute closing basis to open the path toward $4,100. The higher low printed during the Asia session pullback (~$4,046) versus the pre-FOMC low (~$4,008) confirms the structural shift from the bearish sequence of July 28.
Bull / Bear Scenarios
Bull Scenario
Trigger: PCE prints at or below +0.1% MoM → dollar weakens → gold reclaims $4,085 on a 15-minute close → $4,100 as the primary session target, with momentum extension toward $4,120–$4,130 if $4,100 is broken and held into the NY session. EMA stack remains intact above $4,065 throughout.
Bear Scenario
Trigger: PCE prints above +0.2% MoM → dollar firms on revised rate cut expectations → gold breaks below $4,065 on a 15-minute close → retest of $4,055, then $4,046. A sustained break below $4,046 would signal that the post-FOMC recovery is a dead-cat bounce and refocus attention on the $4,026 level as the next major support.
Events Ahead
- Thursday, Jul 30 — 15:30 UTC (18:30 UTC+3) — U.S. Advance GDP q/q + Core PCE Price Index m/m + Unemployment Claims: Today’s triple data release is the dominant catalyst cluster. Soft GDP and soft PCE together would be the strongest dovish combination for gold this week — watch for simultaneous dollar reaction across all three prints.
- Thursday, Jul 30 — 15:00 UTC (18:00 UTC+3) — BOE Gov Bailey Speaks: Sterling volatility secondary; monitor for broader risk sentiment signals that cross into dollar and gold pricing.
- Friday, Jul 31 — Tentative — BOJ Policy Rate Decision + Monetary Policy Statement + Press Conference: A BOJ rate hike or hawkish surprise strengthens the yen, weakens the dollar broadly, and adds a second bullish tailwind for gold into the weekend.
- Friday, Jul 31 — 12:00 UTC (15:00 UTC+3) — Eurozone CPI Flash Estimate y/y + Core CPI Flash Estimate y/y: Soft European inflation reinforces the global disinflation narrative — supportive of gold medium-term.
- Friday, Jul 31 — 15:30 UTC (18:30 UTC+3) — U.S. Employment Cost Index q/q: A key Fed labor cost gauge; a soft print supports the case for cuts and extends any post-PCE gold rally into the weekend.
Analysis based on the XAU/USD 15-minute chart as of July 30, 2026, 14:29 UTC+3. This article is for informational and educational purposes only and does not constitute financial advice.
Post-PCE Update
Price Check
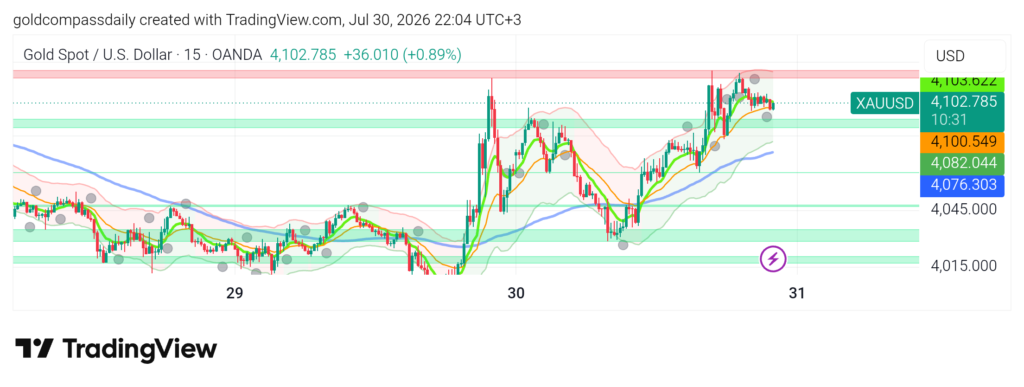
XAU/USD has broken above the $4,100 psychological level and is trading at $4,102.78 as of 22:04 UTC+3, up $36.01 (+0.89%) on the session. The morning article’s primary bull target of $4,100 has been achieved. Price has now recovered from the Tuesday spike low of approximately $4,008 to current levels — a $94 recovery in under 48 hours — driven by the FOMC dovish pivot on Wednesday and today’s PCE confirmation. The fast green MA ($4,103) and orange MA ($4,100) are riding directly at price, acting as real-time dynamic support in one of the tightest bullish EMA configurations visible this week.
What Changed
Today’s data triple — Advance GDP q/q, Core PCE Price Index m/m, and Unemployment Claims — landed collectively on the soft side of expectations, delivering the dovish trifecta that the morning analysis identified as the strongest possible bull catalyst for gold. Core PCE confirmed that inflation continues to cool toward the Fed’s target, GDP reinforced the economic slowdown narrative, and Unemployment Claims provided no hawkish labor market surprise to counteract the dovish impulse. The dollar sold off across the board and gold broke through $4,085 — the key resistance cited in the morning article — before extending the move cleanly through $4,100. The morning article’s bull scenario has played out precisely: PCE soft print → $4,085 reclaim → $4,100 achieved. Price is now in uncharted territory on the near-term chart with the next structural resistance at $4,120–$4,130.
Updated Levels
- Bias: Strongly bullish above $4,100
- Immediate support: $4,100 (psychological / orange MA) → $4,082 (blue level) → $4,076 (slow blue MA, rising)
- Resistance: $4,103 (current green MA ceiling) → $4,120–$4,130 (next structural zone) → $4,150 (extended target)
- Bull continuation trigger: 15-minute close above $4,103 → $4,120 opens
- Pullback invalidation level: Loss of $4,076 on a 15-minute close = momentum stall; reassess
Scenarios Into the Close and Friday
Bull continuation: Price holds above $4,100 through the NY close with the green and orange EMAs maintaining their current tight bullish configuration below price. Asia session on July 31 opens above $4,100, setting up a test of $4,120–$4,130 during the Friday London session. This is the path of least resistance given the staircase structure of higher lows built across the week and the fundamental backdrop now fully aligned dovish — soft GDP, soft PCE, FOMC pivot confirmed.
Post-data consolidation: Price pulls back from the $4,103 green MA ceiling and consolidates in the $4,082–$4,100 range through the NY close as profit-taking sets in after a two-session $94 recovery. A hold above $4,082 would be entirely constructive — the orange MA at $4,100 and blue MA at $4,076 provide layered dynamic support. Friday’s BOJ decision is the wildcard: a hawkish BOJ surprise during the Asia session would strengthen yen, weaken dollar, and add a second non-U.S. catalyst for gold above $4,100.
Chart Analysis
The 15-minute chart at 22:04 UTC+3 on July 30 completes the week’s full price narrative across three sessions. The July 29 base near $4,018, the FOMC breakout to $4,095, the post-FOMC consolidation at $4,046–$4,077, and today’s PCE-driven extension through $4,100 are all visible in a clean staircase structure of higher lows and higher highs. The EMA configuration is the most bullish of the week: the fast green MA ($4,103) and medium orange MA ($4,100) are stacked tightly at price level, confirming that momentum is driving price rather than price running ahead of momentum — a technically healthy condition for continuation. The slow blue MA ($4,076) has reversed its multi-day downtrend and is now rising steeply, providing a widening dynamic support cushion below. Bollinger Bands are expanding upward with price, ruling out an immediate mean-reversion signal. The only technical caution is that price is pressing against the green MA ceiling at $4,103 — a level that needs to be broken and held on a 15-minute closing basis to confirm the next leg toward $4,120.
Update based on the XAU/USD 15-minute chart as of July 30, 2026, 22:04 UTC+3. This update is additive to the morning analysis published earlier today. This article is for informational and educational purposes only and does not constitute financial advice.