

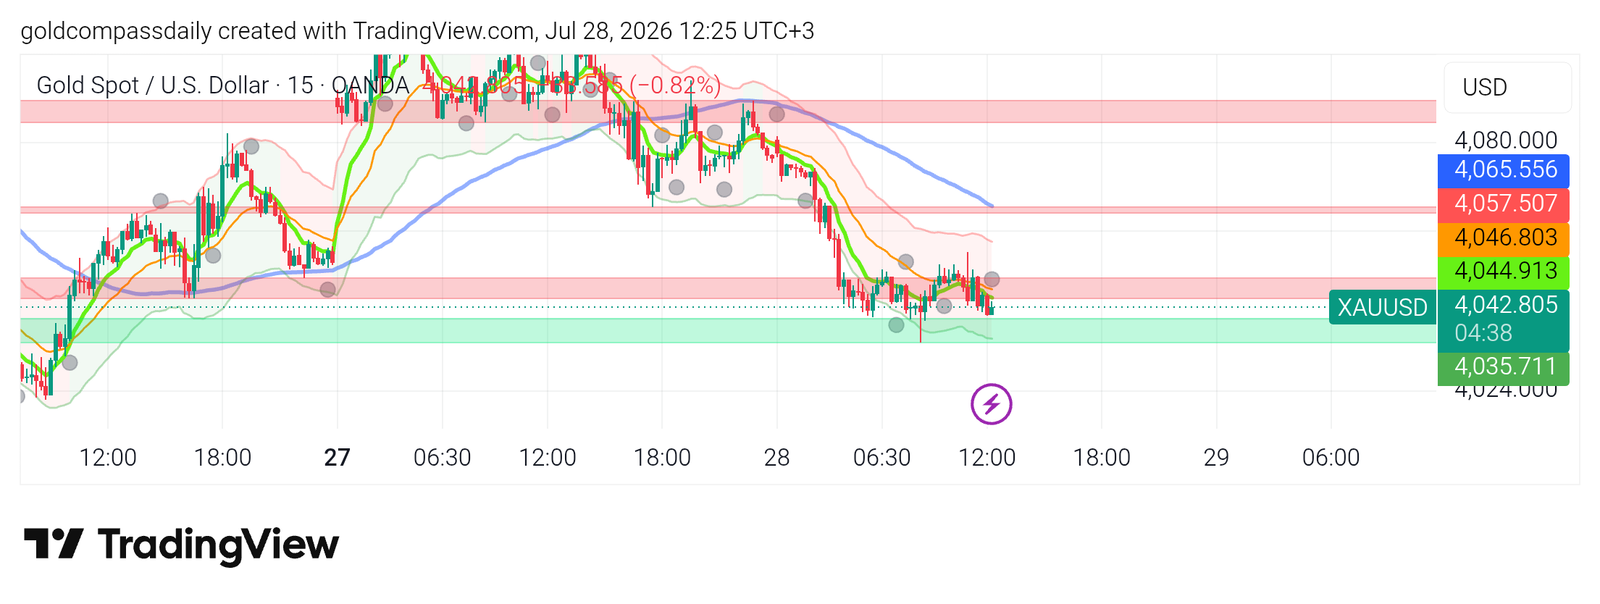
Gold trades cautiously bullish at $4,042 after a sharp intraday pullback from session highs near $4,065 — with the Federal Reserve’s rate decision on July 29–30 now serving as the defining near-term catalyst for the metal. The sell-off from Monday’s highs reflects pre-FOMC positioning rather than a structural reversal, and the $4,035–$4,044 demand zone is now the critical line between a controlled pullback and a deeper corrective move. Price is holding above the lower Bollinger Band on the 15-minute chart, keeping the buy bias intact so long as the zone holds.
Key Levels
- Bias: Cautiously bullish above $4,035
- Support: $4,035 → $4,024
- Resistance: $4,044–$4,046 → $4,057 → $4,065–$4,080
- Session target: $4,057 (conditional on holding $4,035 and FOMC-driven dollar softness)
- Invalidation: Below $4,024 = demand zone failure; corrective structure deepens toward $4,000 psychological level
Catalyst of the Day
The Federal Open Market Committee rate decision — scheduled for July 29–30 under Chair Kevin Warsh — is the single dominant catalyst overhanging the gold market. Markets are not pricing a rate cut at this meeting, but the language of the statement and any shift in forward guidance will determine whether the U.S. dollar firms or weakens into month-end. For gold, a hawkish-leaning hold — emphasizing that the Fed is in no rush to cut rates — reinforces real yield support for the dollar and pressures XAU/USD. A neutral-to-dovish hold, acknowledging cooling inflation and labor market softening, releases that pressure and opens the door for gold to reclaim $4,057–$4,065. Traders should watch the statement release and Chair Warsh’s press conference closely on July 30 for any language referencing the pace of future cuts or balance sheet policy changes.
Fundamental Context
Gold’s pullback from $4,065 is best understood as a positioning flush ahead of the FOMC rather than a sentiment shift. Real yields — the primary fundamental driver of gold’s direction — remain elevated but are showing early signs of softening as markets reassess the pace of Fed tightening under Chair Warsh. When real yields fall, gold’s opportunity cost declines, making it more attractive as a zero-yield asset. When real yields rise, gold faces headwinds. The FOMC outcome on July 30 will reprice real yield expectations across the curve, making it the decisive fundamental event of the week.
The U.S. dollar’s behavior is the transmission mechanism. A stronger dollar compresses gold prices in dollar terms; a weaker dollar provides lift. Dollar strength since Monday’s session — which triggered the sell-off from $4,065 — is consistent with pre-FOMC hedging by institutional players reducing long gold exposure ahead of a binary event. That dynamic historically creates mean-reversion opportunities once the event risk resolves. Friday’s Non-Farm Payrolls report on August 1 provides the next major fundamental checkpoint: a weaker jobs print would reinforce the case for an eventual Fed pivot, adding a second bullish tailwind for gold into the following week. For further context on the week’s macro framework, see Gold Compass Daily’s Week Ahead: FOMC and GDP in Focus.
Chart Analysis
The 15-minute XAU/USD chart as of 12:25 UTC+3 on July 28 shows a clean two-phase structure: a rally from the July 27 open to session highs near $4,065–$4,070, followed by a sharp impulsive sell-off that broke the EMA stack and drove price into the $4,035–$4,044 green demand zone where it is currently consolidating. The fast (green) and medium (orange) EMAs have crossed bearish and are stacked below the slow blue MA — confirming short-term bearish momentum — but critically, price is pressing against the lower Bollinger Band with the gray volume dots clustered at current levels, a pattern consistent with institutional absorption and potential reversal. The dotted blue pivot line near $4,040 is acting as an intraday magnet. The $4,044–$4,057 zone, which was prior support before the breakdown, now acts as the first meaningful resistance block gold must reclaim on any recovery. A sustained hold above $4,035 and a reclaim of $4,046 on the 15-minute close would shift short-term structure back toward the bull case, targeting $4,057 as the first recovery level and $4,065–$4,080 as the broader resistance band above.
Bull / Bear Scenarios
Bull Scenario
Trigger: Price holds $4,035 on any dip and reclaims $4,046 on a 15-minute closing basis → initial target $4,057, with extension toward $4,065–$4,080 on a FOMC-driven dollar softening event. This scenario is reinforced if the U.S. Consumer Confidence data released today comes in below expectations, signaling demand-side weakness that weighs on the dollar.
Bear Scenario
Trigger: Break and close below $4,035 on the 15-minute chart → opens a move toward $4,024, with deeper corrective risk toward the $4,000 psychological level if FOMC rhetoric turns explicitly hawkish. This scenario is reinforced by any surprise upside in U.S. economic data prior to the decision that raises real yield expectations.
Events Ahead
- Tuesday, Jul 28 — 17:00 UTC (20:00 UTC+3) — U.S. Consumer Confidence (forecast: 98.5): A miss below consensus would weaken the dollar and provide near-term support for gold ahead of FOMC.
- Wednesday, Jul 29 — 12:30 UTC (15:30 UTC+3) — U.S. Q2 GDP Advance Estimate (forecast: ~+1.8% annualized): A weaker-than-expected print confirms economic slowdown and supports the case for eventual Fed rate cuts — bullish gold medium-term.
- Wednesday, Jul 30 — 18:00 UTC (21:00 UTC+3) — FOMC Rate Decision + Statement (no change expected): The dominant binary event of the week. Statement language on inflation and rate path is the key trigger for gold’s next directional move.
- Wednesday, Jul 30 — 18:30 UTC (21:30 UTC+3) — Fed Chair Warsh Press Conference: Any dovish signals — acknowledging cooling inflation or signaling cuts are approaching — would be the most direct bullish catalyst for gold this week.
- Thursday, Jul 31 — 12:30 UTC (15:30 UTC+3) — U.S. PCE Price Index (forecast: +0.1% MoM): The Fed’s preferred inflation gauge; a soft print validates a dovish shift and would extend any post-FOMC gold rally.
- Friday, Aug 1 — 12:30 UTC (15:30 UTC+3) — U.S. Non-Farm Payrolls (forecast: ~150K): A weak jobs number reinforces the Fed pivot narrative and provides gold with a second bullish catalyst to close out the week.
Analysis based on the XAU/USD 15-minute chart as of July 28, 2026, 12:25 UTC+3. This article is for informational and educational purposes only and does not constitute financial advice.
Market Close Update — 22:53 UTC+3
Price Check
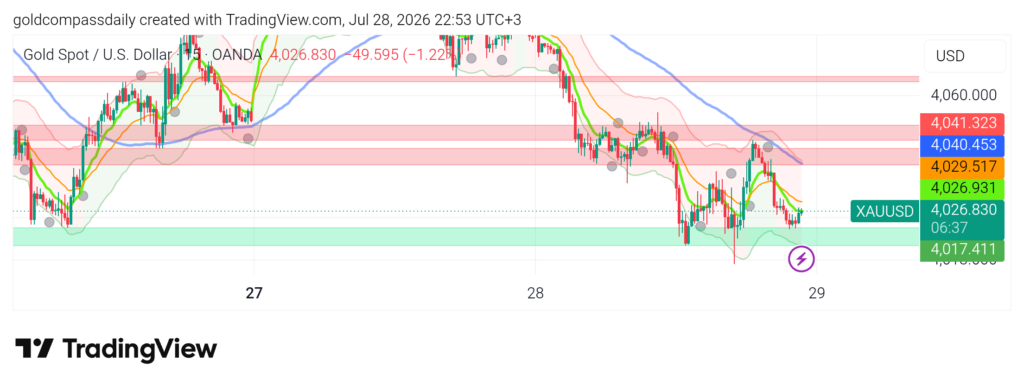
XAU/USD is trading at $4,026.83 as the New York session approaches its close, down $49.60 (-1.22%) on the day. The morning article’s invalidation level at $4,024 was breached intraday, with price printing a session low spike toward $4,015 before partially recovering. The day’s range has been aggressive: from the Asian session high near $4,065 to the NY low near $4,015 — a $50 intraday swing entirely to the downside.
What Changed
The $4,035 demand zone cited in the morning analysis failed to hold. Sellers maintained control through the London-to-NY handoff, and the breakdown accelerated once $4,035 gave way, confirming that pre-FOMC positioning is decisively risk-off for gold heading into tomorrow’s decision. U.S. Consumer Confidence data released during the session did not provide the dollar-softening catalyst needed to support the bull scenario. The bearish EMA stack — with the fast green and orange MAs fully crossed below the slow blue MA — confirms that short-term momentum remains with sellers. The morning buy bias is suspended pending FOMC resolution.
Updated Levels
- Bias: Bearish below $4,041 heading into FOMC
- Immediate resistance: $4,029 → $4,040–$4,041 (now the key reclaim level)
- Support: $4,017–$4,026 (green demand zone) → $4,015 (intraday spike low) → $4,000 (psychological)
- Invalidation of bear structure: Reclaim and close above $4,041 on the 15-minute chart
Scenarios Into the Close and FOMC
Bear continuation: Price fails to reclaim $4,029 on any bounce attempt and closes the NY session below $4,026. Overnight Asia session tests $4,015 again, with $4,000 as the next structural target if that level fails ahead of or immediately after the FOMC statement. This remains the path of least resistance given current momentum.
Pre-FOMC stabilization: Price holds the $4,015–$4,017 green demand zone through the close and consolidates in the $4,020–$4,035 range overnight. This is the base-case scenario if sellers exhaust near current levels — a pre-event consolidation pattern typical ahead of binary catalysts. A hold here keeps the FOMC reaction trade alive: a neutral-to-dovish statement on July 30 could produce a sharp recovery toward $4,057–$4,065 from deeply oversold 15-minute conditions.
Chart Analysis
The 15-minute chart at 22:53 UTC+3 shows price sitting directly on the dotted blue pivot line near $4,026, inside the upper edge of the green demand zone ($4,015–$4,017). The intraday spike wick below $4,015 is a notable structural detail — a wick of that magnitude into a defined support zone is consistent with a short-term capitulation flush rather than a clean breakdown, and price recovered above $4,026 within the same session. However, the EMA stack remains fully bearish with the fast MAs acting as dynamic resistance at $4,029–$4,041, and there has been no bullish reclaim signal on the 15-minute timeframe as of this update. The Bollinger Band lower boundary is again being tested, mirroring the morning setup — but with the morning support at $4,035 now acting as overhead resistance, the structural context is materially more bearish than at the time of the original article.
Update based on the XAU/USD 15-minute chart as of July 28, 2026, 22:53 UTC+3. This update is additive to the morning analysis published earlier today. This article is for informational and educational purposes only and does not constitute financial advice.